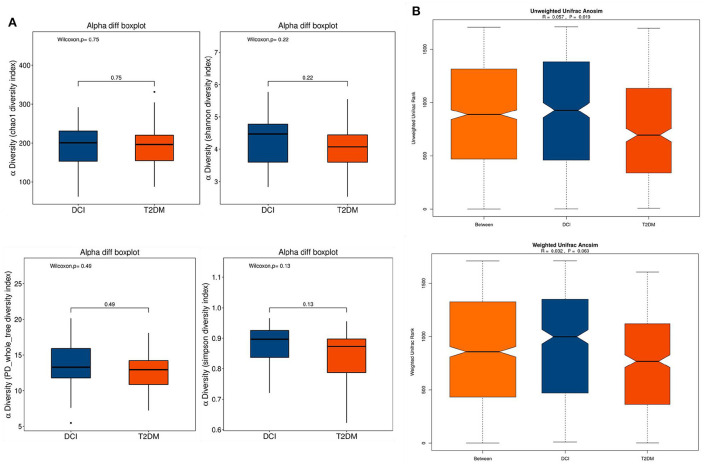
Figure 1.
The α-diversity and β-diversity indices of the fecal microbiota in DCI and T2DM groups. (A) Box plots depict differences in the fecal microbiota diversity indices between the two groups according to the Chao1, Shannon, PD whole tree and Simpson indices based on the OTU counts. Each box plot represents the median, interquartile range, minimum, and maximum values. (B) Unweighted and weighted ANOSIM Unifrac analysis based on the distance matrix of UniFrac dissimilarity of the fecal microbial communities in DCI and T2DM groups. Respective ANOSIM R values and significant P-values show the community variation between two groups. The axes represent the two dimensions explaining the greatest proportion proportion of variance in the communities. OTU, operational taxonomic unit, ANOSIM, analyses of similarities.

