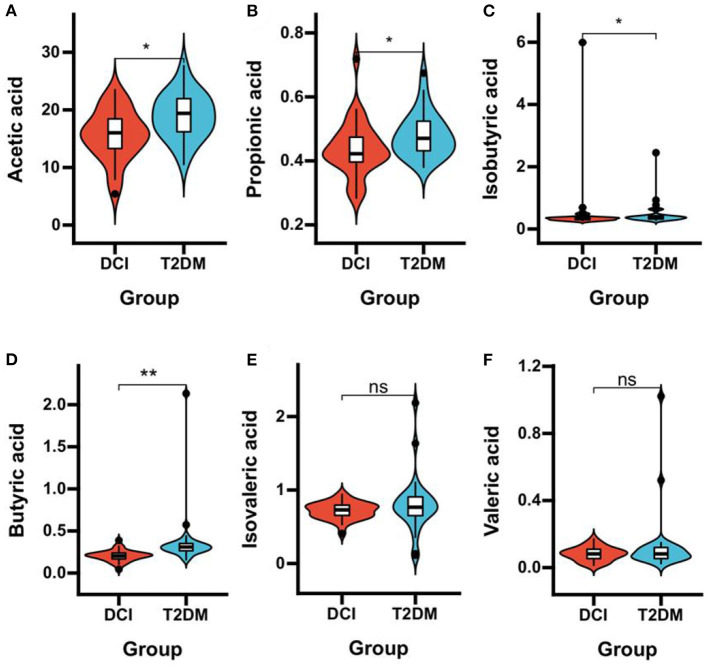
Figure 3.
Comparison of the plasma concentrations of SCFAs in DCI and T2DM groups. Violin plot showing data density and median with interquartile range for plasma concentrations of acetic acid (A), propionic acid (B), isobutyric acid (C), butyric acid (D), isovaleric acid (E), and valeric acid (F) in DCI and T2DM groups. *P < 0.05, **P < 0.001.

