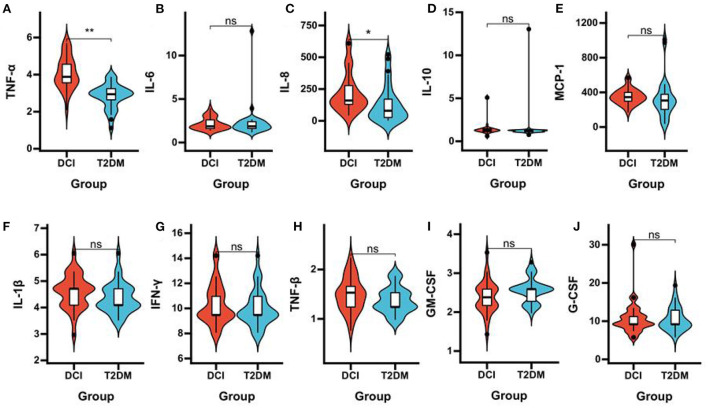
Figure 4.
Comparison of the plasma concentrations of inflammatory cytokines in DCI and T2DM groups. Violin plot showing data density and median with interquartile range for plasma concentrations of TNF-α (A), IL-6 (B), IL-8 (C), IL-10 (D), MCP-1 (E), IL-1β (F), IFN-γ (G), TNF-β (H), GM-CSF (I), G-CSF (J) in DCI and T2DM groups.*P < 0.05, **P < 0.001.

