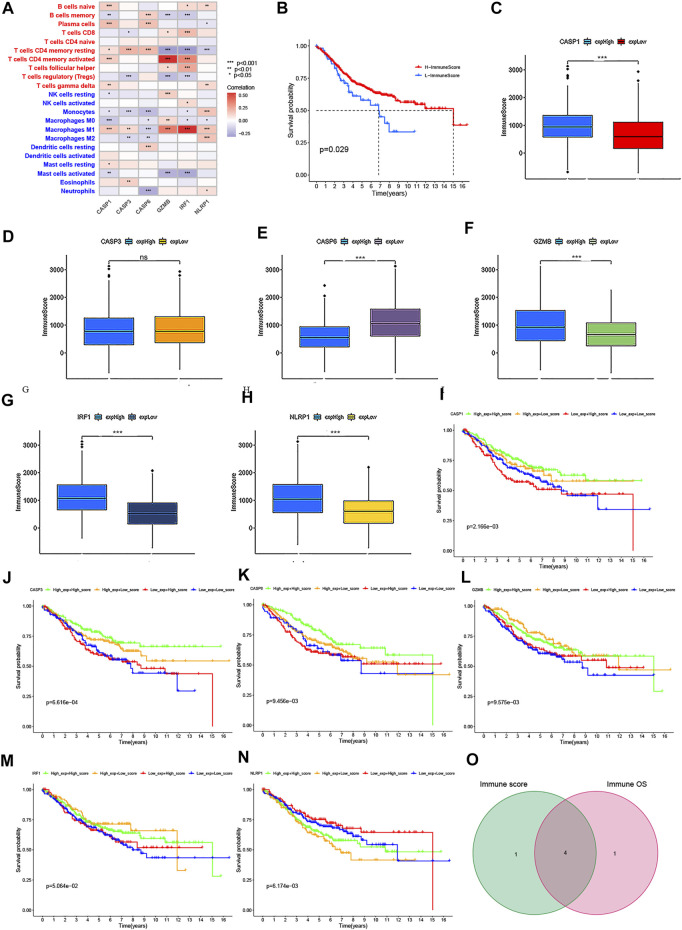
FIGURE 12.
Correlation of the immune score with the OS of patients in CRC. (A) Relationships between the abundance of 22 types of immune cells and six PRG signatures. (B) Kaplan–Meier curves for the high- and low-immune score with the cut-off value -11.072 of 579 CRC patients. (C–H) Relationships between the expression levels of six PRG signatures and immune score with the cut-off value -11.072 of 579 CRC patients. (I–N) Kaplan–Meier curves for CRC patients in immune score and PRG signature expression subgroups. (O) Venn plot showed four common PRG signatures based on both immune score and prognosis. p < 0.05 was the cut-off. *p < 0.05; **p < 0.01; and ***p < 0.001.

