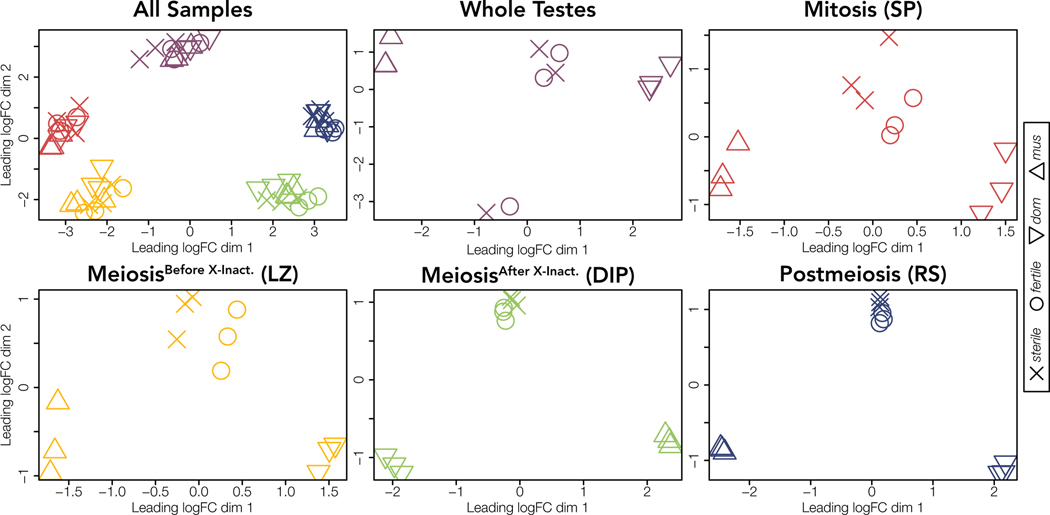
Figure 2. Sample type then cross type drives differences in expression profiles.
Multidimensional scaling (MDS) plots of distances among and within sample types for expressed genes across all chromosomes. Distances are calculated as the root-mean-square deviation (Euclidean distance) of log2 fold changes among genes that distinguish each sample. Each cross is indicated by a symbol (mus = △, dom = ▽, fertile = O, and sterile = X). Samples are colored by sample type (red = Mitosis, yellow = MeiosisBefore X-Inact., green = MeiosisAfter X-Inact., blue = Postmeiosis, and purple = Whole Testes). The upper left MDS plot includes all sample types and remaining plots show each sample type individually. Each sample type for each cross is represented by three replicates.

