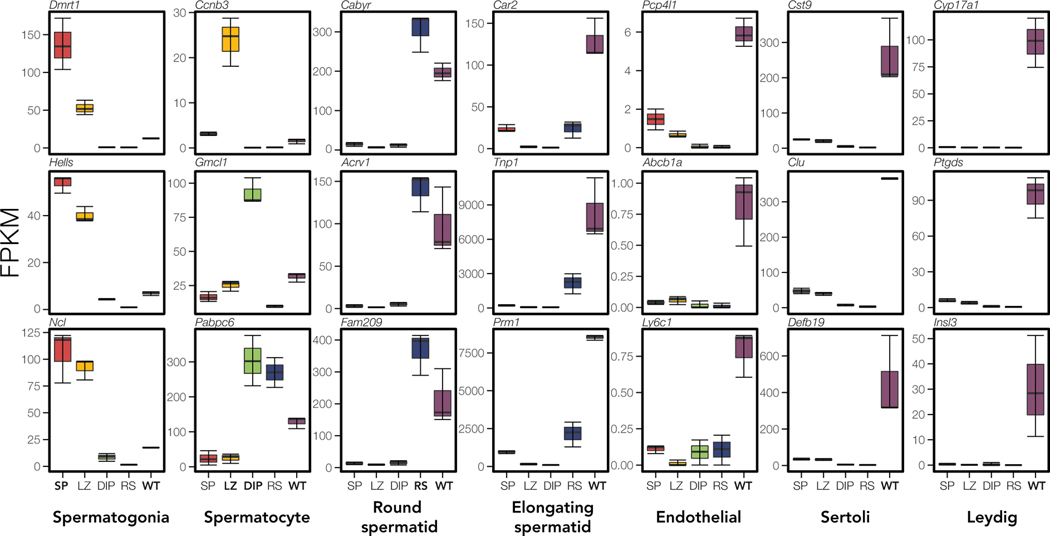
Figure 3. Whole testes show signatures of more diverse cell types than enriched cell populations.
Expression of cell-specific marker genes (Green et al. 2018) across each sample type for dom reference samples. We quantified expression (FPKM) of three marker genes (rows) associated with testes-specific cell types (columns). Each panel displays marker expression in each sample type (red = Mitosis (SP), yellow = MeiosisBefore X-Inact. (LZ), green = MeiosisAfter X-Inact. (DIP), blue = Postmeiosis (RS), and purple = Whole Testes (WT)). Sample types are bolded in each panel where marker gene expression is expected. Note, Ccnb3 expression is specific to MeioticBefore X-Inact. cells (Maekawa et al. 2004), and Gmc1 is specific to MeioticAfter X-Inact. cells (Nguyen et al. 2002).

