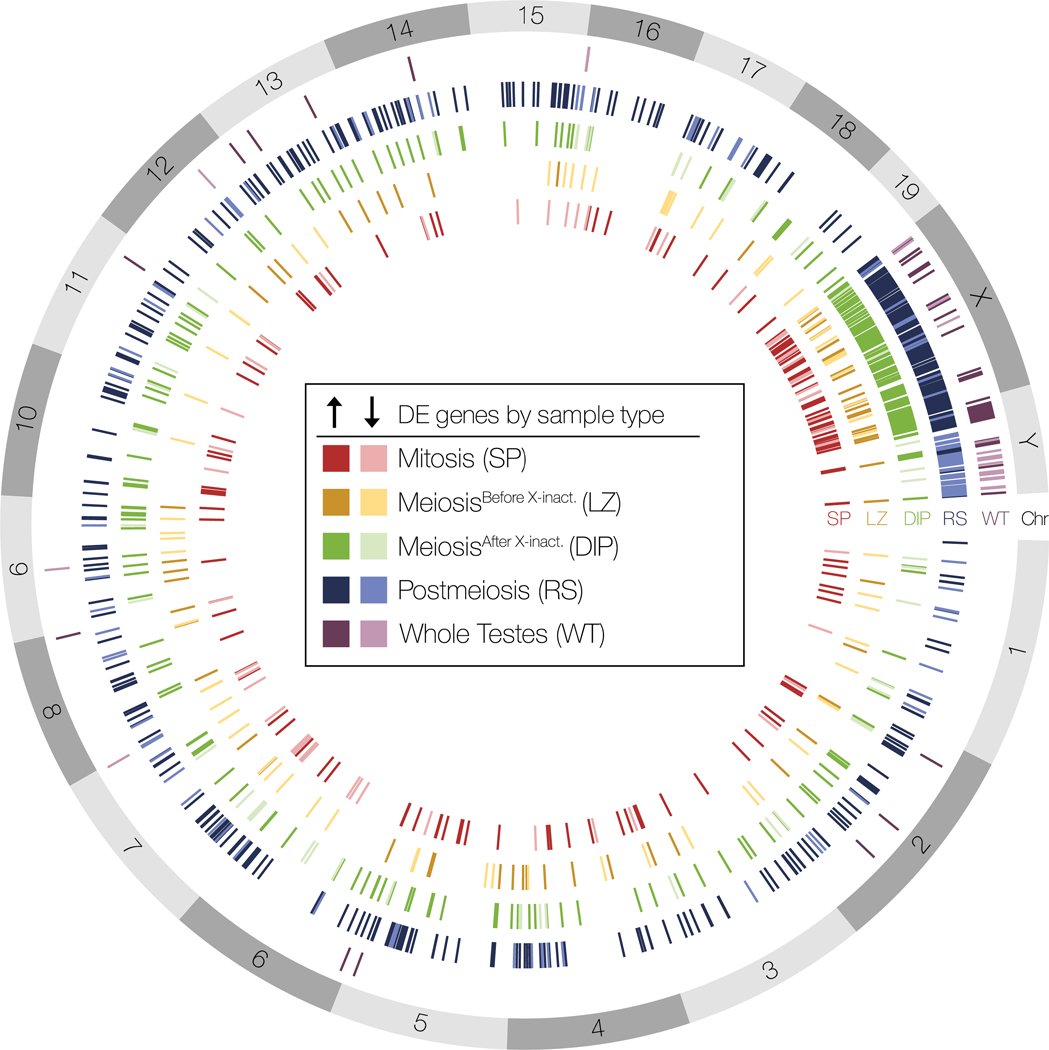
Figure 6. Whole testes and enriched cell populations differed in the number and identity of dfferentially expressed genes.
Spatial distribution of differentially expressed (DE) genes across reference mouse genome chromosomes (build GRCm38.p6) between sterile and fertile hybrids for all five sample types. Darker colors indicate genes up-regulated in sterile hybrids and lighter colors indicated genes down-regulated in sterile hybrids.

