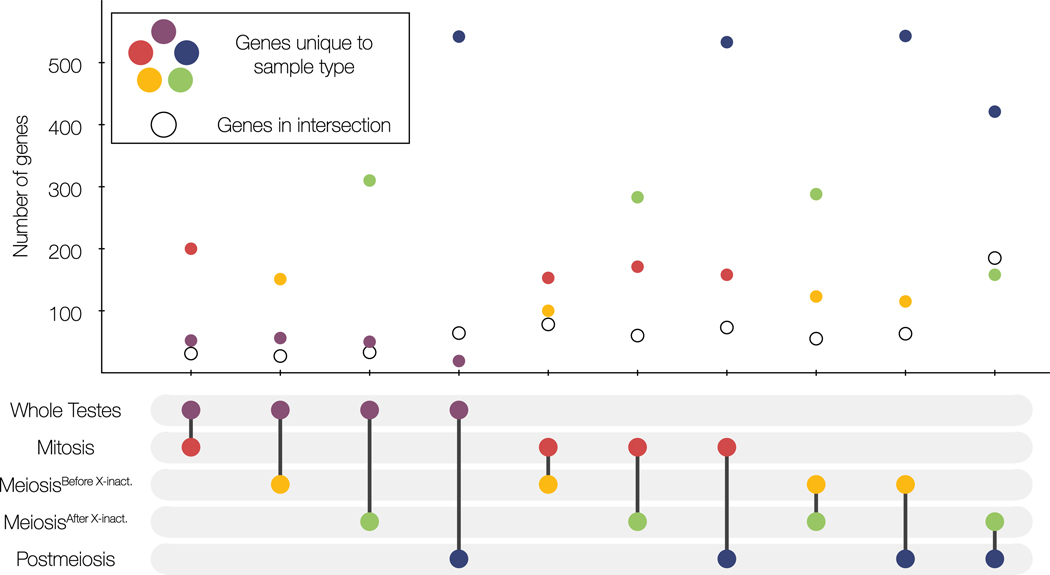
Figure 7. Whole testes and enriched cell populations differed in pairwise comparisons of DE genes between sterile and fertile hybrids.
The sample types in each comparison are indicated by the pair of connected dots in the bottom panel. For each comparison, DE genes common between the two sample types are indicated with a hollow circle and DE genes unique to each sample type in that comparison are colored by sample type (red = Mitosis, yellow = MeiosisBefore X-Inact., green = MeiosisAfter X-Inact., blue = Postmeiosis, and purple = Whole Testes).

