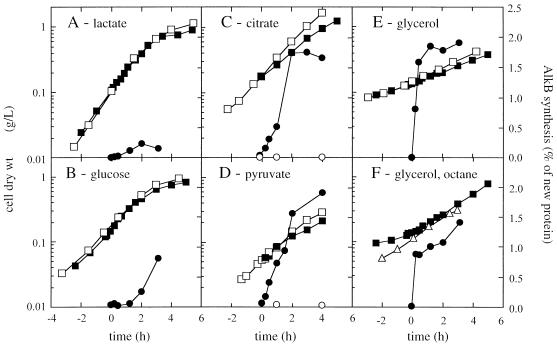
FIG. 3.
Growth and relative AlkB synthesis rates in P. oleovorans cultures growing on different carbon sources. The cultures were induced at t = 0, after which cell samples were pulse-chase-labeled with [35S]methionine at the indicated time points. Growth of noninduced (□) and induced (■) cultures is expressed as dry weight of cells. AlkB was immunoprecipitated from cell lysates, and its synthesis rate was quantified relative to total protein synthesis as described in Materials and Methods. AlkB synthesis in noninduced (○) and induced (●) cultures was expressed as weight percentage of newly synthesized protein. For induction, 0.05% (vol/vol) DCPK was used for the cultures grown on lactate (A), glucose (B), citrate (C), pyruvate (D), and glycerol (E). The culture in panel F was grown on glycerol and induced with 5% (vol/vol) n-octane. In addition, growth of a P. oleovorans culture with 5% (vol/vol) n-octane as sole carbon source is indicated (▵) in panel F.

