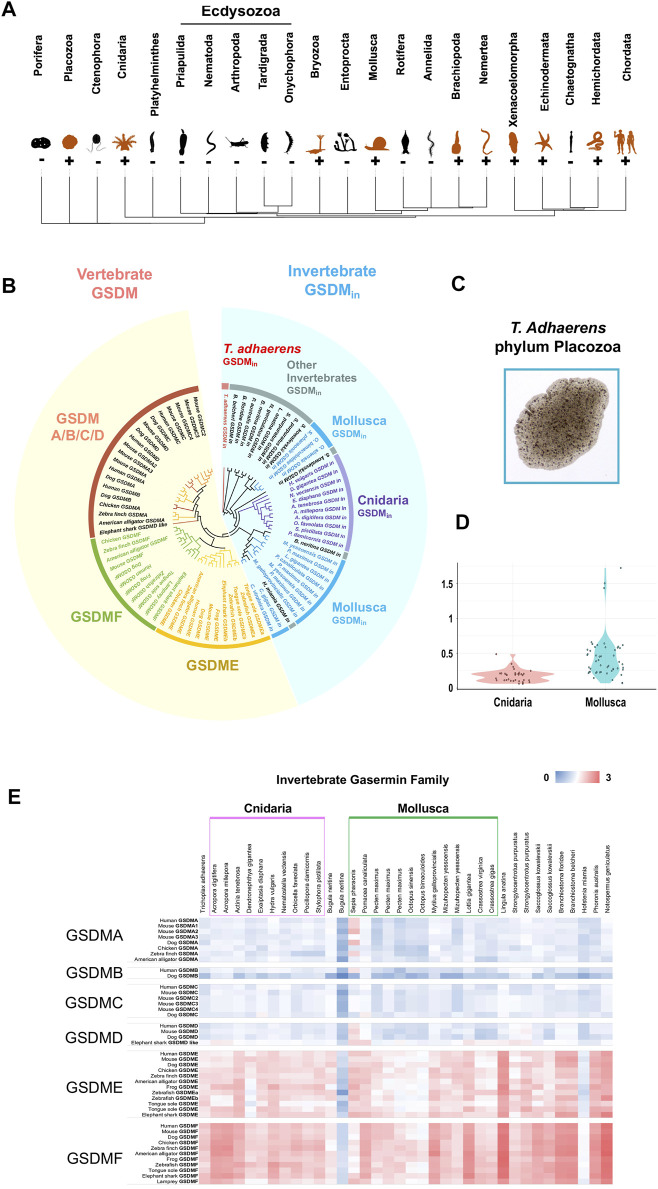
FIGURE 1.
The identification and phylogenetic analysis of invertebrate GSDM. (A) The phylogenetic tree of the major metazoan phyla with GSDM distribution. Orange and black icons indicate GSDM-positive and negative phyla, respectively. (B) The phylogenetic analysis of GSDM in invertebrate and vertebrate. The different categories of GSDM and metazoan clades are presented in different colors. The vertebrate and invertebrate GSDM are shaded with yellow and blue, respectively. (C) A micrograph of Trichoplax adhaerens (phylum: Placozoa). (D) The violin plot showing the Ka/Ks ratios of GSDMin in Cnidaria and Mollusca. (E) The genetic distance between invertebrate GSDMin and vertebrate GSDMA/B/C/D/E/F. The color from blue to red indicates decreasing genetic distance.

