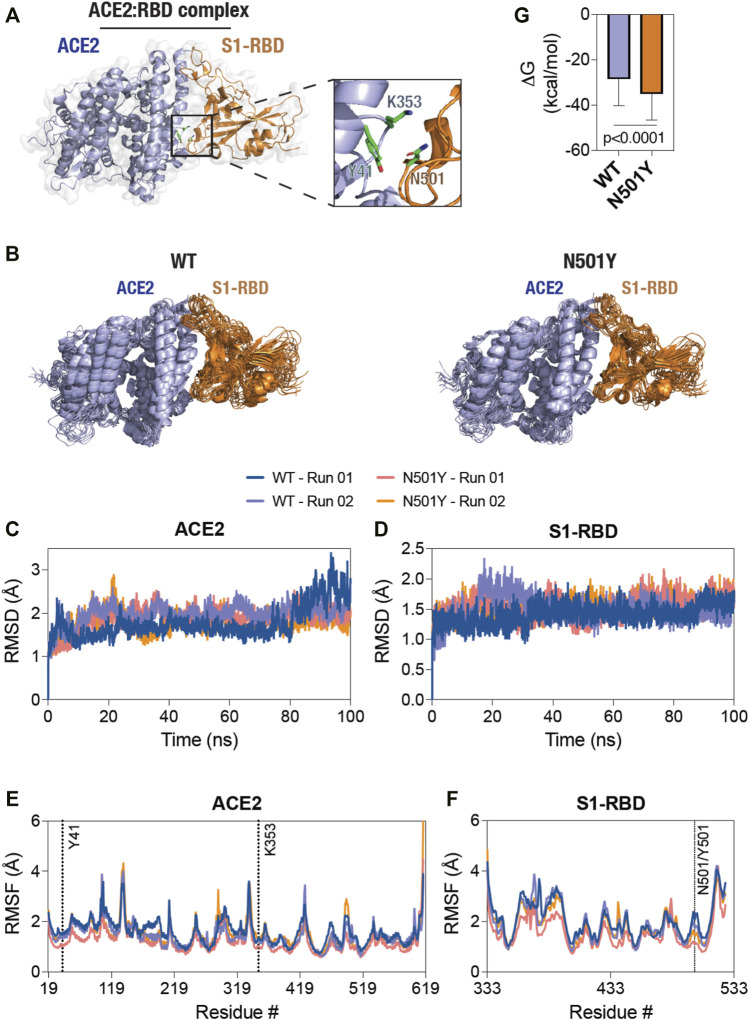
FIGURE 1.
Decreased structural dynamics of the N501Y mutant S1-RBD in complex with ACE2. (A) Cartoon representation of the ACE2-S1-RBD structure (PDB: 6M0J (Lan et al., 2020) showing the relative positioning of residues Y41 and K353 in ACE2 (light blue) and residue N501 in S1-RBD (orange). (B) Cartoon representation of the WT (left panel) and the N501Y mutant (right panel) ACE2-S1-RBD complex showing structural evolution of the complex over time in a 100 ns all-atom, explicit solvent MD simulation. Composite images were prepared using 11 consecutive frames from up to 100 ns simulations with each frame being 10 ns apart. (C, D) Graph showing backbone (Cα) root-mean-square deviation (RMSD) values of ACE2 (C) and S1-RBD (D) obtained from the simulation of the WT and N501Y mutant ACE2-S1-RBD complexes. (E,F) Graph showing backbone (Cα) root-mean-square fluctuation (RMSF) values of ACE2 (E) and S1-RBD (F) obtained from up to 100 ns simulations of the WT and N501Y mutant ACE2-S1-RBD complexes. (G) Graph showing binding free energy changes (ΔG, kcal/mol) obtained from the last 50 ns of MD simulation using the MM-PBSA method (mean ± S.D.).

