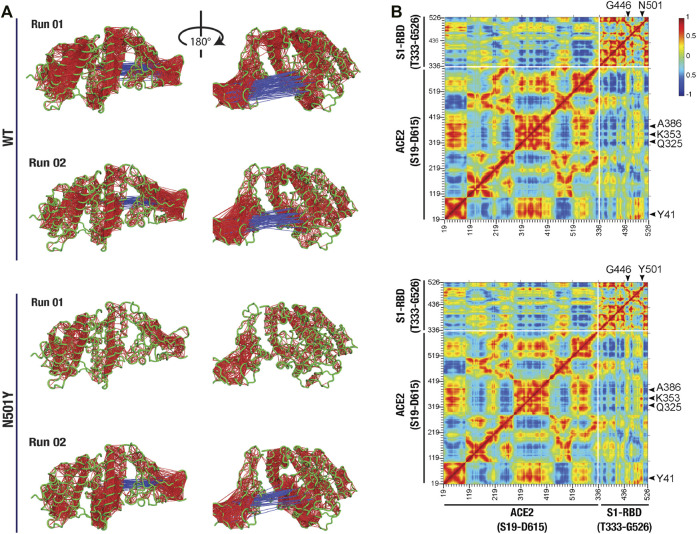
FIGURE 3.
Altered dynamical cross-correlated motions in the ACE2-S1-RBD N501Y mutant complex. (A) Cartoon representation of ACE2-S1-RBD WT (top two panels) and N501Y mutant (bottom two panels) complex showing DCC values (cut-off, ±0.8). Note the positively correlated motions observed between Y501 and G502 on S1-RBD and residues K353 and G354 on ACE2 in the mutant complex but not in the WT complex, while less dynamically anti-correlated motions were observed in the mutant complex compared to the WT complex. (B) Heat map showing average DCC values from two independent 100 ns MD simulations of the WT (top panel) and the N501Y mutant (bottom panel) ACE2-S1-RBD complex (cut-off, ±0.8). Note the higher dynamically cross-correlated motions between residues at the interface in the N501Y mutant complex. Also note the global decrease in the anti-correlated motions in the mutant complex.

