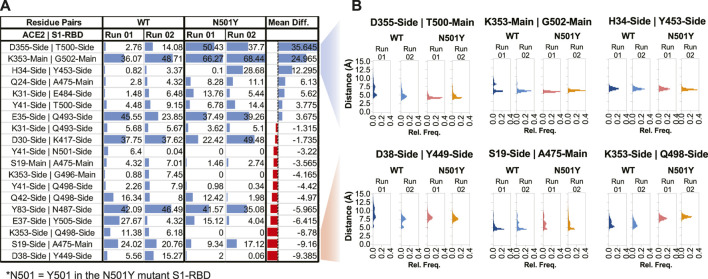
FIGURE 4.
Altered H-bonding between ACE2-S1-RBD interfacial residues. (A) Table showing H-bonds formed at the interface by applying a cut-off of 3.5 Å distance, 20° angle, and ≥5% occupancy time. Numbers represent the % occupancy time of the H-bond during the total simulation time. (B) Histograms representing distance measurements between H-bond forming pairs that showed the highest alterations in H-bond formation at the interface. Mean Diff, Mean difference, i.e., difference between H-bond mean percent occupancy time of the WT and mutant complexes. Blue and red colors indicate increase and decrease in occupancy time, respectively, in the mutant complex.

