Abstract
Electronic cigarettes (ECIGS) are a class of tobacco products that emit a nicotine-containing aerosol by heating and vaporizing a liquid. Apart from initiating nicotine addiction in nonsmokers, a persistent concern about these products is that their emissions often include high levels of carbonyl species, toxicants thought to cause most non-cancer pulmonary disease in smokers. This study examined whether the phenomenon of film boiling can account for observations of high carbonyl emissions under certain operating conditions, and if so, whether film boiling theory can be invoked to predict conditions where high carbonyl emissions are likely. We measured the critical heat flux for several common heating materials and liquids, and carbonyl emissions for several ECIG types while varying power. We found that emissions rise drastically whenever power exceeds the value corresponding to the critical heat flux. While limiting the heat flux to below this threshold can greatly reduce carbonyl exposure, ECIG manufacturer operating instructions often exceed it. Product regulations that limit heat flux may reduce the public health burden of electronic cigarette use.
Keywords: Electronic cigarette, emissions, carbonyls, toxicants, film boiling, heat flux, critical heat flux, regulation
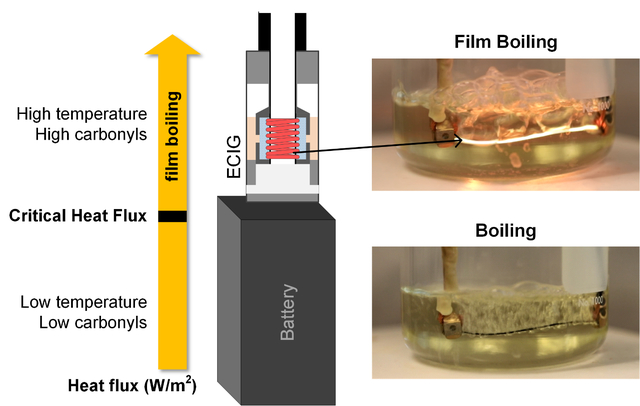
Graphical Abstract
INTRODUCTION
Electronic cigarettes (ECIGs) are a rapidly growing class of tobacco products that contain an electrical heating filament or “coil” and a liquid-saturated wick (Figure 1). When the coil is powered, it heats and vaporizes the liquid to produce an inhalable nicotine-containing aerosol mist. The potential benefits and risks of ECIGs to public health are a subject of much debate among scientists and policymakers. On the one hand, ECIG toxicant emissions, may be lower than those of combustible cigarettes 1–5 and may, therefore, reduce disease risk in smokers who switch. On the other hand, ECIGs may initiate nicotine-naïve individuals to a lifetime of addiction and may ultimately induce population-wide increases in combustible tobacco use.6–8 Apart from nicotine addiction, a persistent health concern surrounding ECIG use is that it may expose users to carbonyl compounds (CCs), a class of potent respiratory toxicants thought to induce the majority of non-cancer pulmonary disease in cigarette smokers.9–10 Carbonyls, including formaldehyde and acrolein, are produced by thermal degradation of the major ECIG liquid constituents, namely propylene glycol (PG) and vegetable glycerin (VG).11–14 A key question for product regulation is the degree to which carbonyls and other toxic thermal degradation products can be minimized by product design and operation constraints.
Figure 1.
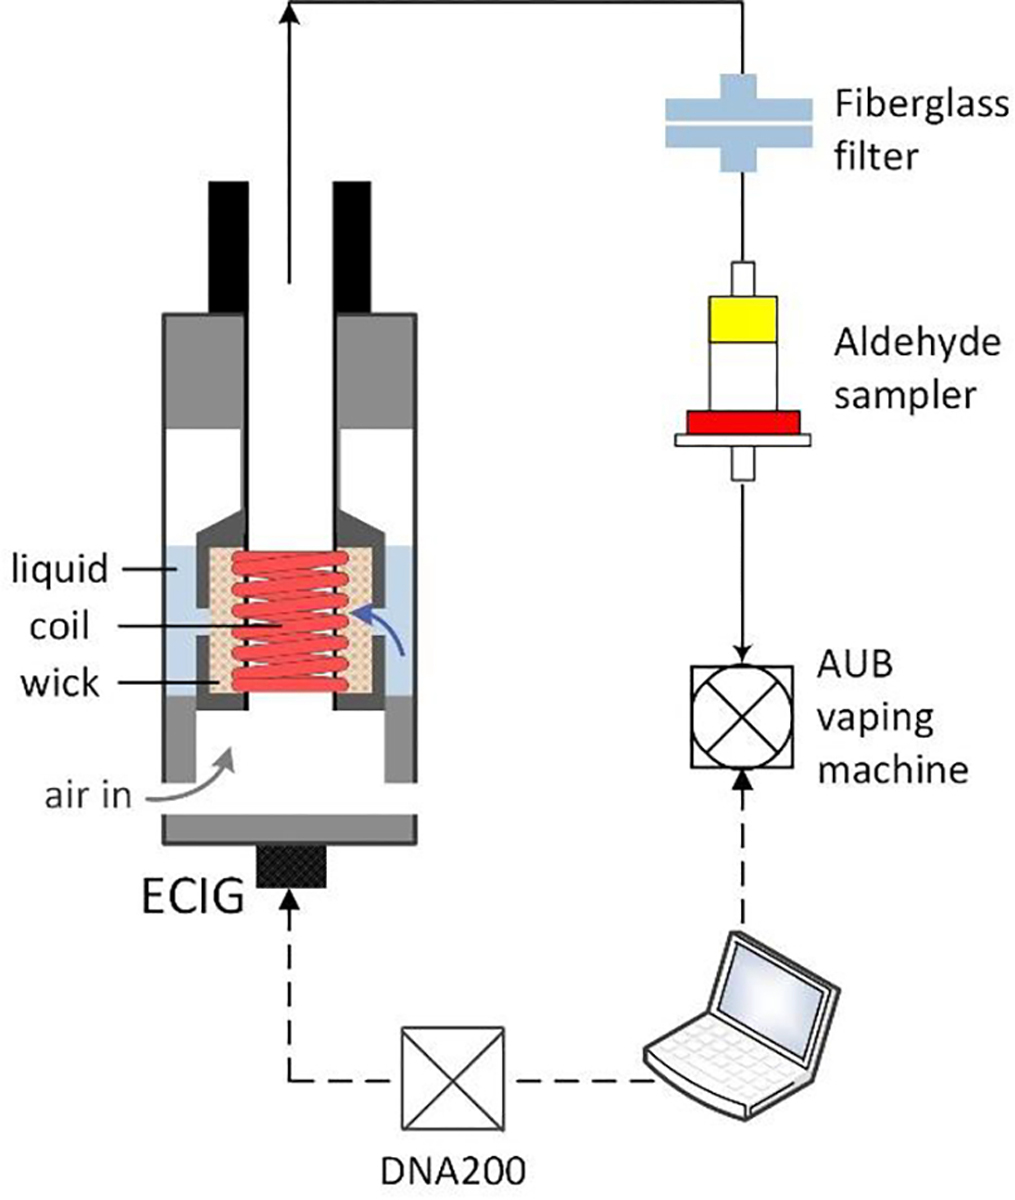
Schematic of an ECIG and experimental setup (see supplementary text S1: Materials and Methods for details)
Studies have reported wide ranges of CC emissions, ranging from negligible quantities to several combustible cigarette equivalents in a few puffs.1–2, 13, 15–20 We have previously shown that electrical power input normalized by heating coil surface area (heat flux, q”, kW/m2) predicts CC emissions across devices.16 However, there are ECIG operating conditions in which small increases in power result in disproportionately larger CC emissions.17, 19 We refer to this condition as the “high carbonyl regime” or HCR, during which CC emissions may increase by orders of magnitude. To date, laboratory observations of high CC emissions have been attributed to “dry-puffing”, a scenario in which the ECIG wick runs dry, allowing the coil to reach sufficiently high temperatures that the remaining traces of liquid thermally degrade to form carbonyls.21–23
Dry-puffing may occur when liquid is vaporized by the coil more rapidly than fresh liquid can replenish the wick. However, while studying ECIG toxicant emissions, we have regularly observed HCR onset even when the coil-wick system was well-saturated by liquid. In this study, we examined an alternative construct to understand and predict the onset of HCR, namely a thermo-physical phenomenon known as “film boiling”.24–25
Film boiling can occur at the interface of a submerged, heated surface. If the heat flux exceeds a threshold, a thin vapor film forms between the hot surface and the surrounding liquid. This film acts as an insulator, impeding heat transfer from the surface, causing surface temperature to rise drastically. The threshold heat flux is called the critical heat flux, or CHF (kW/m2). CHF can be measured or computed theoretically based on liquid properties. If HCR onset is due to film boiling, then CHF can provide a readily computed metric for the probability that a given ECIG design and operating condition will lead to high CC emissions. Potentially, CHF could guide product design regulations for public health ends.
The primary purpose of this study was thus to examine whether CHF predicts the onset of HCR for a given ECIG design. To test this theory, we first submerged typical ECIG heating wires that differed by geometry and material and examined whether film boiling occurs in ECIG wire-liquid systems under heat flux conditions that are relevant to ECIG operation. Second, we measured temperature, liquid vaporized, and CC emissions for three different categories of ECIGs over a range of powers and tested whether approaching and exceeding CHF coincides with both HCR onset and behaviors characteristic of film boiling: onset of high-temperature, followed by a limited-vaporization regime in which additional increments in heat flux do not result in greater liquid vaporization rate. Third, we triangulated by varying the ECIG liquid composition and therefore the intrinsic CHF of the wire-liquid combination, and checked whether observed changes in CHF corresponded to predictions from film boiling theory. Finally, using a historical database, we examined whether CHF predicted HCR for a large number of ECIG devices operated under a wide range of conditions.
RESULTS AND DISCUSSION
Do ECIG wires exhibit film boiling at relevant heat fluxes?
We investigated whether ECIG coil-liquid systems can transition to film boiling under plausible heat fluxes (q”). To do so, we submerged several nickel ECIG wires of varying geometry in PG and powered them in increasing increments while continuously recording their temperatures. Nickel wires are commonly used in temperature-controlled ECIG devices because the relatively high temperature coefficient of resistance (TCR) of nickel makes electrical resistance a convenient surrogate measure of mean wire temperature. We observed the temperature record for signs of transition to film boiling and recorded the CHF. Simultaneously, we visually observed changes to the wire-liquid system as q” increased (Video S1). The visual observations can be described as follows: at low q”, we observed convective motion of the liquid and no sign of bubble formation. As we increased q”, visible bubbles began to form and detach from the wire surface, indicating a transition from natural convection to nucleate boiling. Nucleate boiling continued and intensified with increasing q” until bubbles began joining to form larger bubbles, and eventually a vapor film over parts of the wire. As we further increased the power, the vapor film grew in length and the wire started to glow red; simultaneously, its recorded temperature increased drastically. This last stage describes the transition to the film boiling regime, where the heating surface is no longer in direct contact with the liquid, and therefore its temperature can depart markedly from the liquid boiling temperature, Tb. Previous literature describing boiling processes for submerged wires are similar to this account.26
Figure 2B shows an example of the measured temperature (superheat: ΔTexcess = T − Tb), for one nickel wire submerged in PG. The data show that with increasing q”, a threshold is reached where ΔTexcess jumps, indicating a transition to the film boiling regime (i.e. q” > CHF). Beyond this threshold, ΔTexcess continued to increase monotonically with increasing q”. q” was calculated as: q” = IR2/(πDLN), where I is the current (A), R is the heating wire resistance (Ω), D is the diameter (m) of the wire, L is the length (m), and N is the number of wires (see Equation 1 in supplementary text S1: Materials and Methods for details). Figure 2C shows that all submerged nickel wires exhibited qualitatively the same behavior. We found that CHF varied between 241 and 474kW/m2, with a mean(SD) of 343(105) kW/m2. A summary of the data is included in Table S3.
Figure 2. Critical heat flux determination for nickel wires submerged in PG.
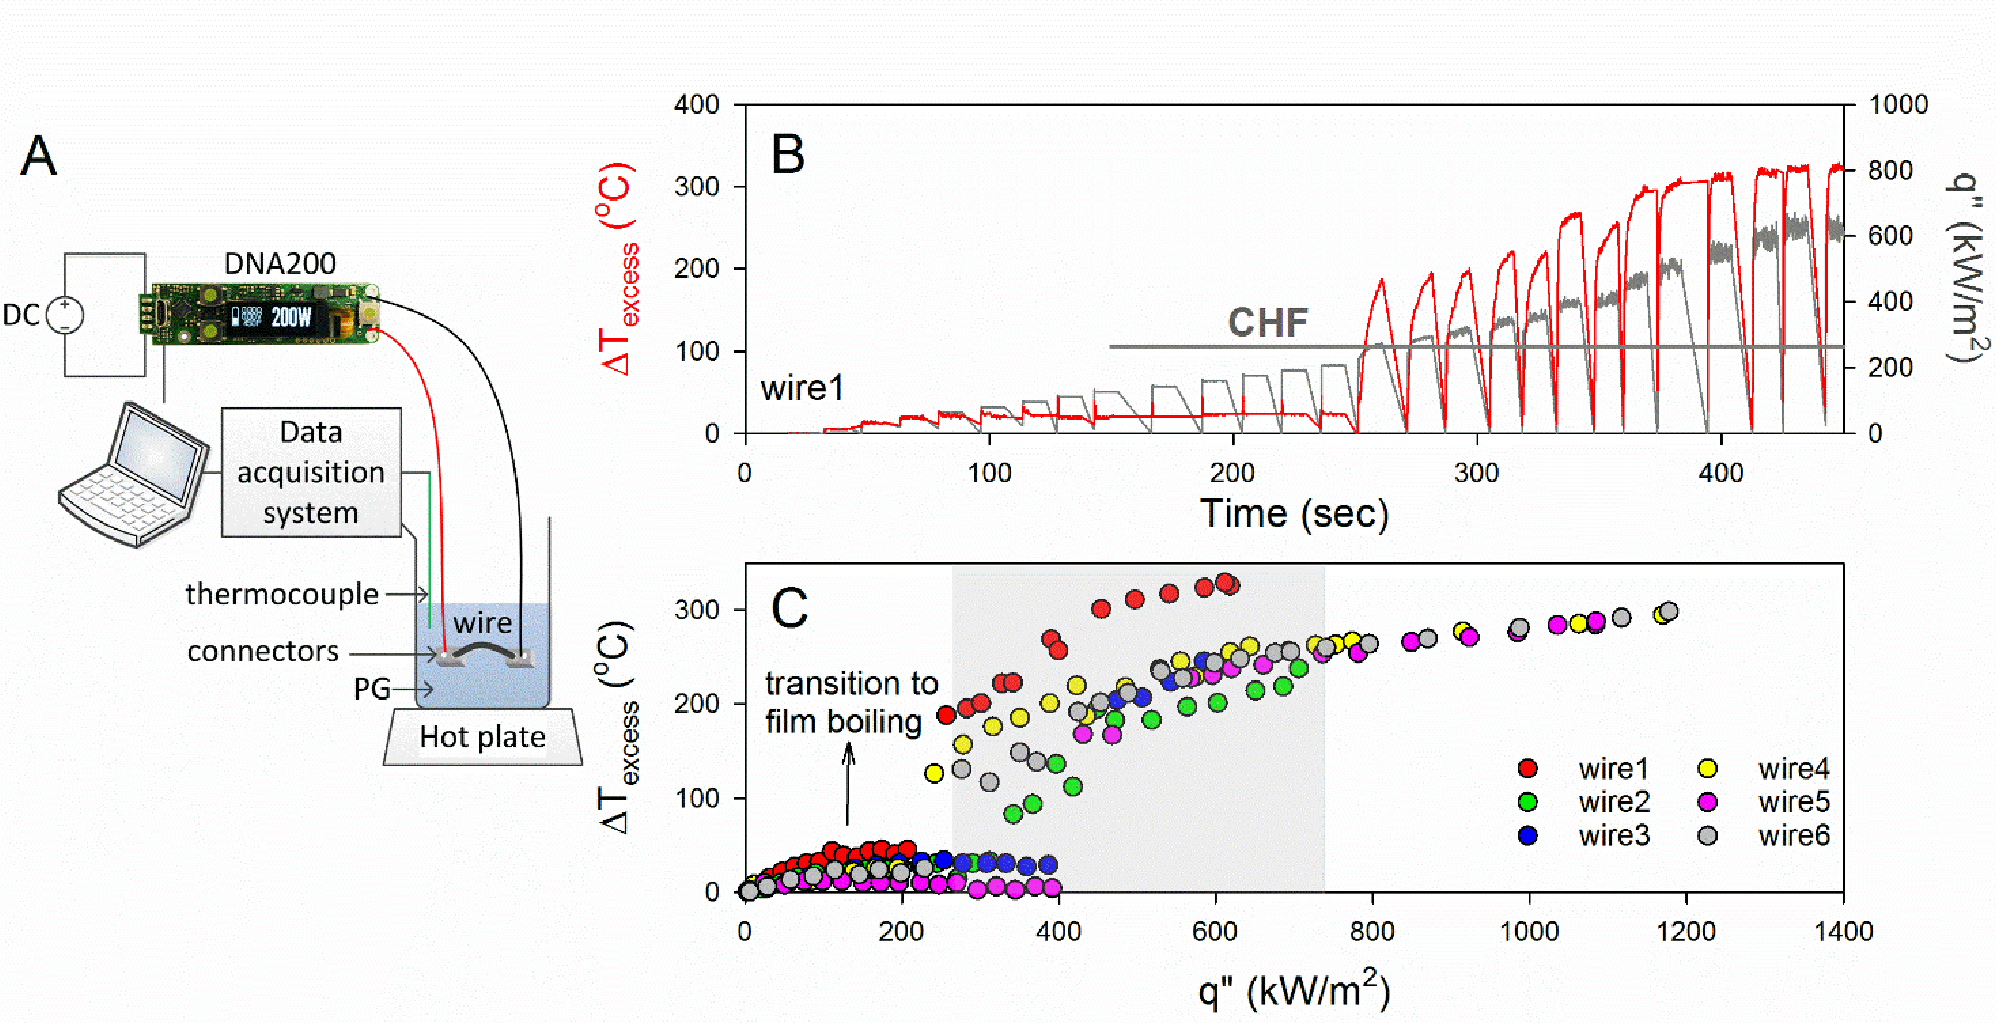
(A) Schematic of the experimental setup. The setup consists of nickel wires submerged in a saturated solution of PG and powered using a power supply controlled by a DNA200 circuit board (see supplementary text S1: Materials and Methods for details) (B) Example of the superheat profile vs. q” for one wire. (C) Maximum coil superheat as a function of q” for all tested nickel wires that differ by surface area (126–188mm2) (Table S3); shaded area corresponds to the manufacturer recommended range of operating powers for the VF and SMOK V12-Q4 ECIG devices shown in Figure S1.
We also determined CHF for kanthal and nichrome wires using the same visual observation technique. Interestingly, the data showed variations in CHF across metals, with kanthal exhibiting the highest mean(standard deviation) CHF of 510(76)kW/m2 followed by nichrome, 390(73)kW/m2, and nickel, 340(105)kW/m2. Except for the CHF of nichrome and nickel, which were found to be similar, CHF varied significantly across metals. The difference in CHF across metals has been previously reported and hypothesized to result from differences in TCR;27 CHF and TCR were reported to be inversely related. Similarly, in this study, the metal with the highest TCR, nickel,28 resulted in the lowest CHF, and the one with the lowest TCR, kanthal,29 resulted in the highest CHF.
Importantly, manufacturer-recommended maximum powers for several ECIGs tested here correspond to values exceeding CHF (Table S1). Thus submerged ECIG wires can exhibit film boiling at heat fluxes relevant to ECIG operation.
Do ECIG devices exhibit evidence of film-boiling at relevant powers?
We examined temperature response and aerosol emissions while varying power input to three different off-the-shelf models of ECIGs that varied by heating wire material of construction, atomizer geometry, and basic design (see Materials and Methods for details). One of the three models, the SMOK TF-N2, utilized a nickel heating coil, allowing mean wire temperature to be recorded during puffing.
Figure 3A shows time plots of mean coil temperature measured when individual puffs of 4 sec duration were drawn through the SMOK TF-N2 ECIG device. Plots are arranged in order of increasing power from left to right. The boiling temperature of PG is shown for reference (Tsat). It can be seen that starting at puff 3 (q”=207 kW/m2), the temperature rapidly reached and then plateaued at Tsat; subsequent puffs 4–6 showed the same behavior, despite the continuing increase in thermal input. At puff 7 (315 kW/m2), the wire temperature rapidly reached boiling as with the previous puffs, but then continued to rise, albeit at a lower rate. In subsequent puffs at still greater heat inputs, a similar rapid rise to Tsat is apparent, however the rate of temperature rise and the final excess temperature continue to increase with increasing heat input (Figure 3B). The data thus clearly indicate three distinct operating regimes: evaporation (puffs 1–3, q”< 207kW/m2), boiling (puffs 4–6, 207 < q” < 315kW/m2), and superheat (puffs 7 and greater, q”> 315kW/m2). The transition from boiling to superheat regimes appears to occur between 315 kW/m2 and 347 kW/m2; this value is consistent with the mean CHF of 343 kW/m2 that we observed for nickel wires submerged in the same liquid (Figure 2B and C). This data is consistent with the notion that film boiling can occur in ECIG devices.
Figure 3. Temperature profile of a nickel-coil ECIG, during operation, at increasing heat fluxes.
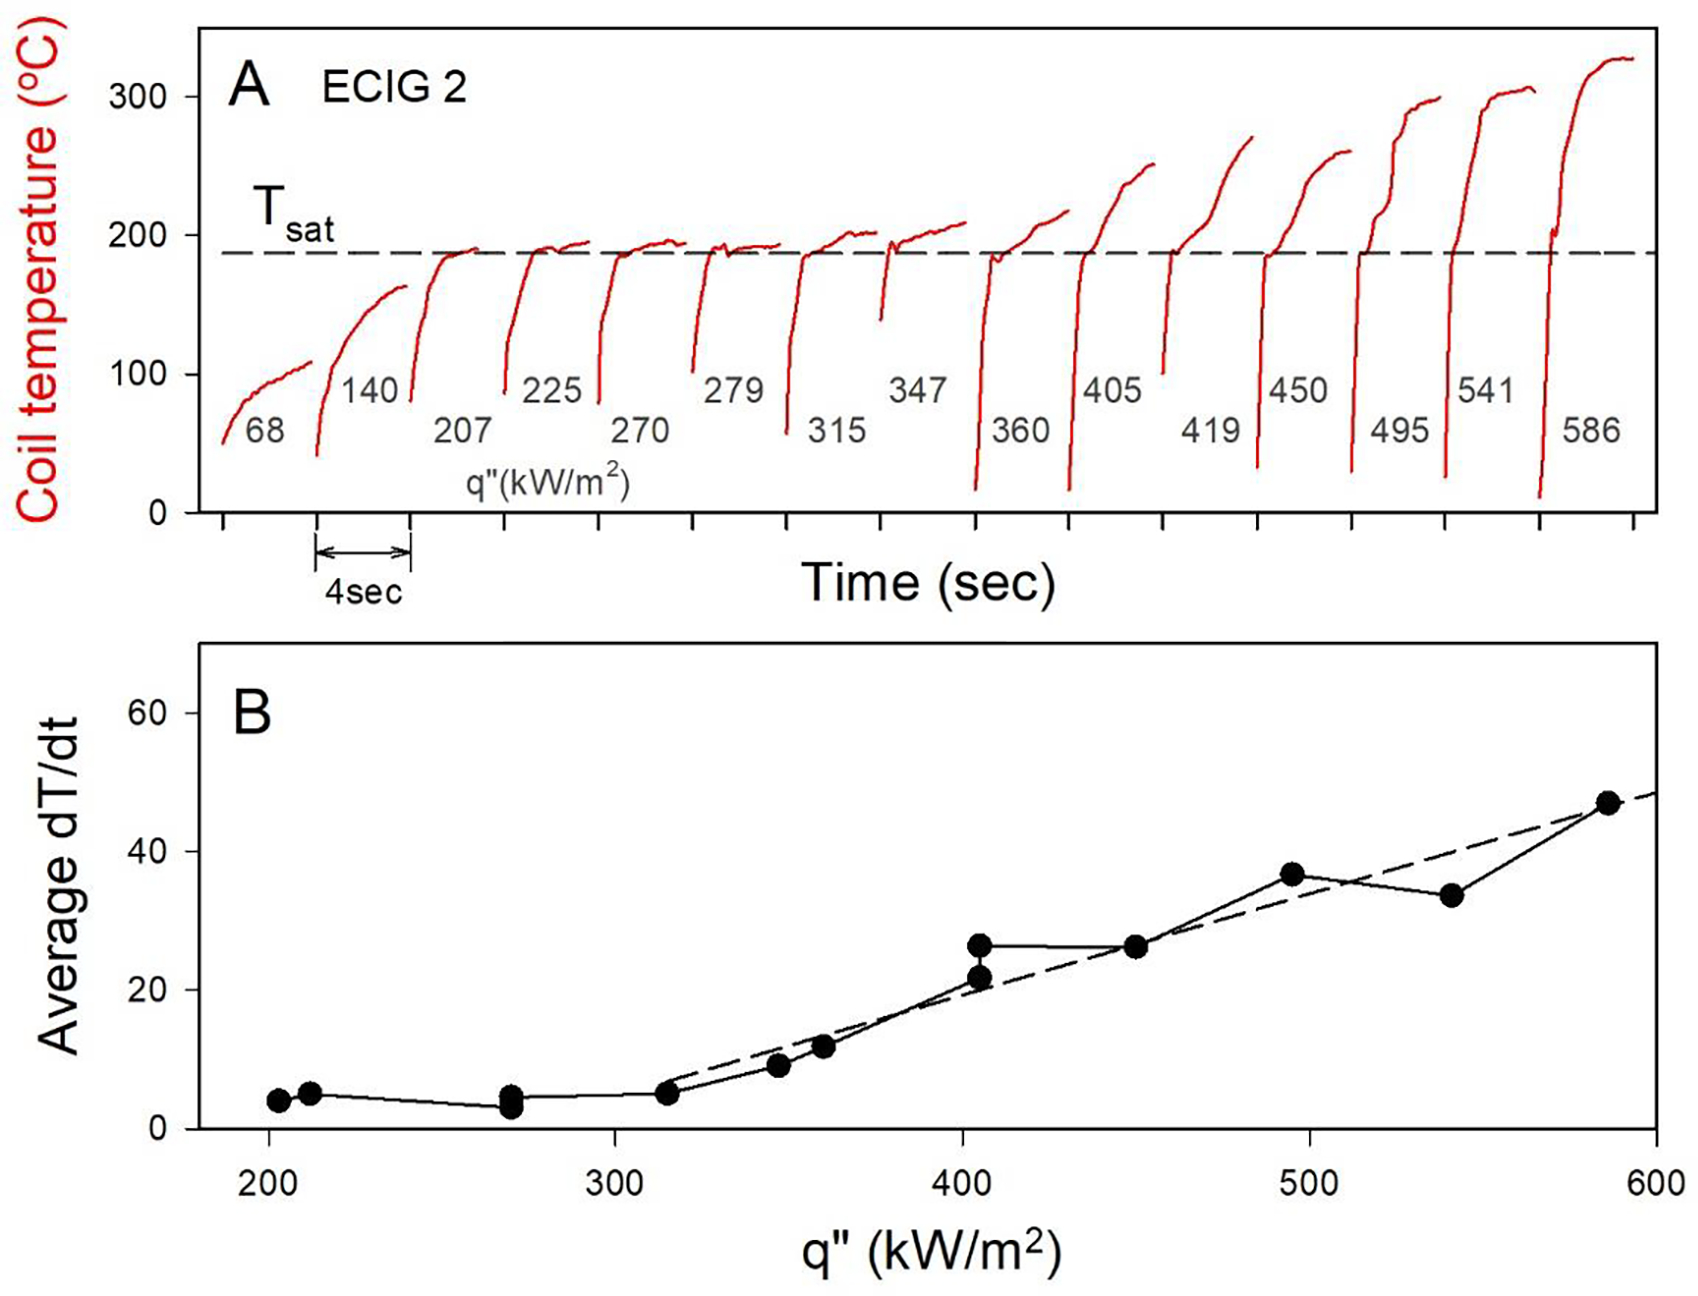
(A) Temperature profile for a sequence of repeated puffs, at stepwise increasing power for one SMOK TF-N2 ECIG. Note: the time axis is truncated between puffs for convenience of display. (B) Average rate of change in temperature vs. q” for data in panel A, once the system reaches Tsat. Dashed line indicates best fit for linear portion of the rise in dT/dt.
Another window on film boiling in ECIGs is provided by observing the mass of liquid vaporized from the device as power input is increased. In particular, if a transition to film boiling occurs, the insulating effect of the vapor layer forming around the coil will impede further heat transfer to the liquid, and therefore result in diminishing returns in the amount of liquid vaporized with additional increments in q”. The mass of liquid vaporized versus q” is shown in Figure 4 for the three ECIG devices examined in this study. For all three devices, at the lower heat fluxes, we observed a linear relationship between heat flux and mass of liquid vaporized; the greater the input, the proportionately greater the liquid vaporized. For heat fluxes greater than CHF, we found that additional heat flux resulted in diminishing returns in liquid vaporized. For example, for the SMOK TF-N2 device, a 50% increase in heat flux from 200 to 300 kW/m2 resulted in an approximate 50% increase in liquid vaporized, while increasing q” from 400 to 600 kW/m2 resulted in no significant increase in liquid vaporized. In this mode of operation, a greater fraction of the heat input goes into heating the wire itself and into greater conduction losses through the wire leads. Importantly, this plateau occurs within the manufacturer’s recommended operating ranges for the VF Platinum and the SMOK V12-Q4, shown in shaded gray (there are no power guidelines for the SMOK TF-N2).
Figure 4. Liquid vaporized and total carbonyl yields vs. q” for the examined ECIG devices.
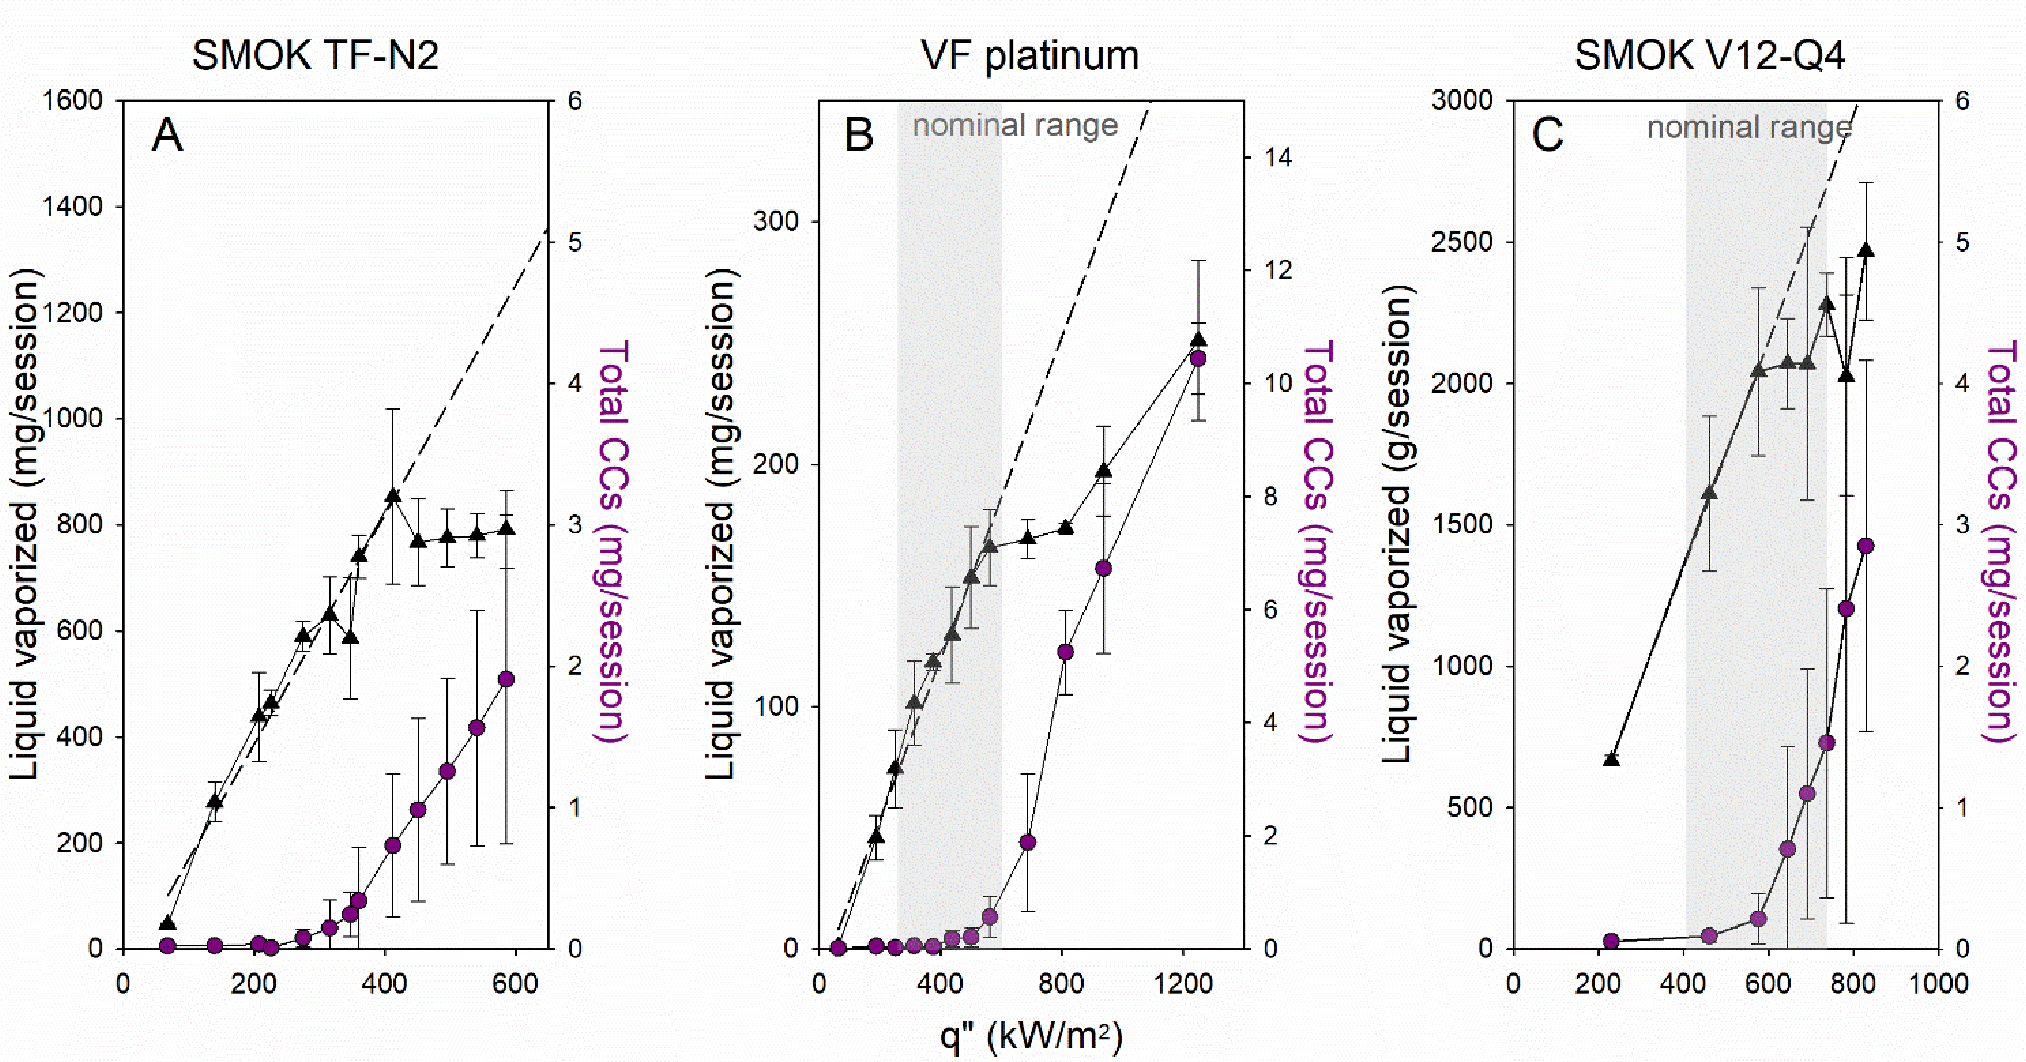
Mean (STD) liquid consumed (triangles) and total carbonyl (circles) yields vs. q” (N=3 per condition). (A) SMOK TF-N2, (B) VaporFi platinum, and (C) SMOK V12-Q4. Dashed line indicates best fit for linear portion of the vaporization curve. Shaded area indicates the q” range corresponding to manufacturer’s recommended battery settings and device geometry; SMOK TF-N2 has no manufacturer recommendations (Table S1).
Also shown in Figure 4 are the CC yields per 15 puffs. Importantly, we found that the sharp increase in CC yields coincided with the plateau in liquid vaporized. Because carbonyls are thermal degradation products of PG and VG,12, 21, 30 a sharp rise in carbonyls is consistent with a rise in the coil temperature; for the SMOK TF-N2 device, we indeed found that the superheat regime coincided with the rise in carbonyls. Table S4 includes a summary of the data. Although the examined CC species covered a broad range of volatilities, we report total CCs as an aggregate quantitative indicator of thermal degradation of the parent liquids. We note, however, that when we examined individual species (e.g., formaldehyde; Figure S5) we found the same trends as reported for the total. We further note that nearly all the examined CC species are toxic and/or carcinogenic, and therefore total CCs represents a convenient indicator of toxicant emissions.
In summary, we found that when CHF was exceeded, the ECIG coil temperature exceeded the PG boiling temperature, the ECIG exhibited a plateau in vaporization rate, and CC yields rose sharply. Importantly, the manufacturer’s recommended windows of operation for the SMOK V12-Q4 and VaporFi devices exceed the CHF. Thus, it is apparent that ECIG devices operating with PG liquid can exhibit film boiling behavior at plausible powers, and that onset of high carbonyl emissions is coincident with the onset of the transition to film boiling.
How is film boiling behavior affected by liquid composition?
Vegetable glycerin (VG) is the other major solvent used in ECIG liquids. Relative to PG, VG has a greater molar mass, and exhibits a higher boiling temperature, surface tension, heat of vaporization, and viscosity (Table S2). The Zuber equation (29) indicates that a heated surface submerged in VG should therefore exhibit a 50% greater CHF than if it were submerged in PG.
We repeated the submerged nickel wire measurements using VG liquid and found that the system transitioned to film boiling at much higher heat fluxes than PG, and did so in a manner that resulted in catastrophic wire burnout; it was impossible to sustain a complete puff with a flux equal to or greater than CHF. We found the mean CHF for nickel wires submerged in VG to be equal to 866kW/m2 (Figure S6A), more than double the mean attained with PG (343 kW/m2).
We also examined the mass of liquid vaporized and CC emissions for the SMOK TF-N2 filled with VG, up the maximum power attainable with the EScribe power supply for this setup. Table S5 includes a summary of the data. We found that the liquid vaporized continued to increase monotonically throughout the tested power range. Figure 4 shows the striking difference between the vaporization behavior of the PG and VG cases; PG vaporization plateaued at 350 kW/m2, while VG vaporization continued to rise throughout the test range. Consistent with this finding, the temperature profiles of the heating coil of the SMOK TF-N2 device did not depart from the previously described boiling regime. Namely, during each puff, the temperature rapidly rose to boiling, and then remained at boiling for the remainder of the puff (Figure S6B). Most importantly, we found that across the range of heat fluxes examined, CC emissions did not rise drastically, unlike the case with PG (Figure 5B).
Figure 5. Effect of liquid composition on the film boiling behavior.
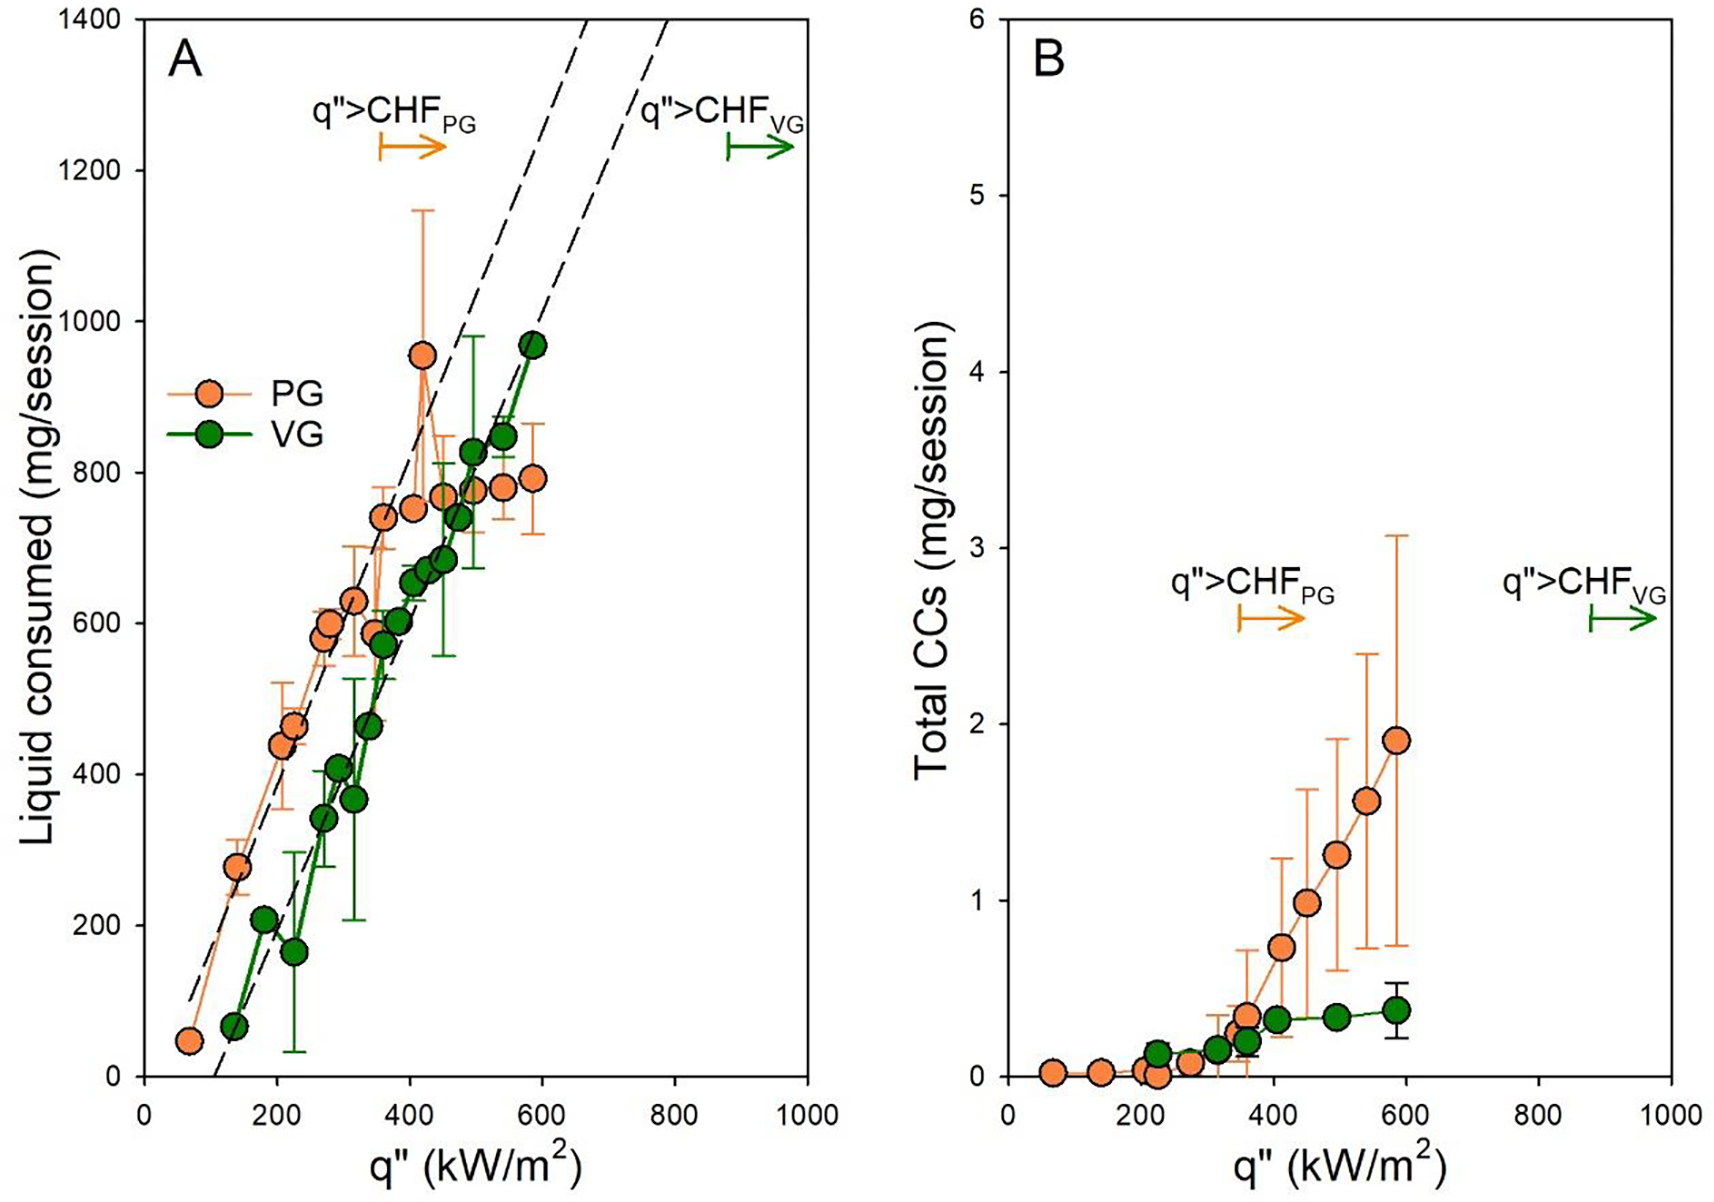
Mean (STD) liquid consumed (A) and total CCs (B) vs. q” (N=3 per condition) for the SMOK TF-N2 device filled with PG vs. VG. Dashed lines represents best fit linear regression for q”≤CHF
In summary, all the signatures previously attributed to film boiling disappeared when PG was substituted with VG, under otherwise identical conditions, and carbonyl emissions remained proportional to q”.
Might limited vaporization, high temperatures, and high carbonyl emissions result from wicking limitations rather than film boiling?
Many of the above reported observations could be explained by an alternative hypothesis that high carbonyl emissions result from dry puffs during which the liquid vaporization rate exceeds the rate at which fresh liquid can be wicked to the heating coil. For example, Figure 5 could indicate that the wick of the SMOK TF-N2 device transports PG at an intrinsically lower rate than VG, and that this rate-limiting process explains the observed vaporized liquid plateau for PG and not VG.
We compared the transport rates for PG and VG in vertically-suspended ECIG wicks. Figure 7 shows six IR images recorded at various points in time relative to the beginning of wick immersion in side-by-side beakers filled with PG or VG. The images show that PG always traveled a greater distance at a given time. Thus, the fact that VG vaporization continues to rise with q” while PG plateaus indicates that wicking transport limitations are not responsible for the phenomena observed when the CHF threshold is crossed.
Figure 7. CC results from 431 aerosol samples that include 25 different ECIGs.
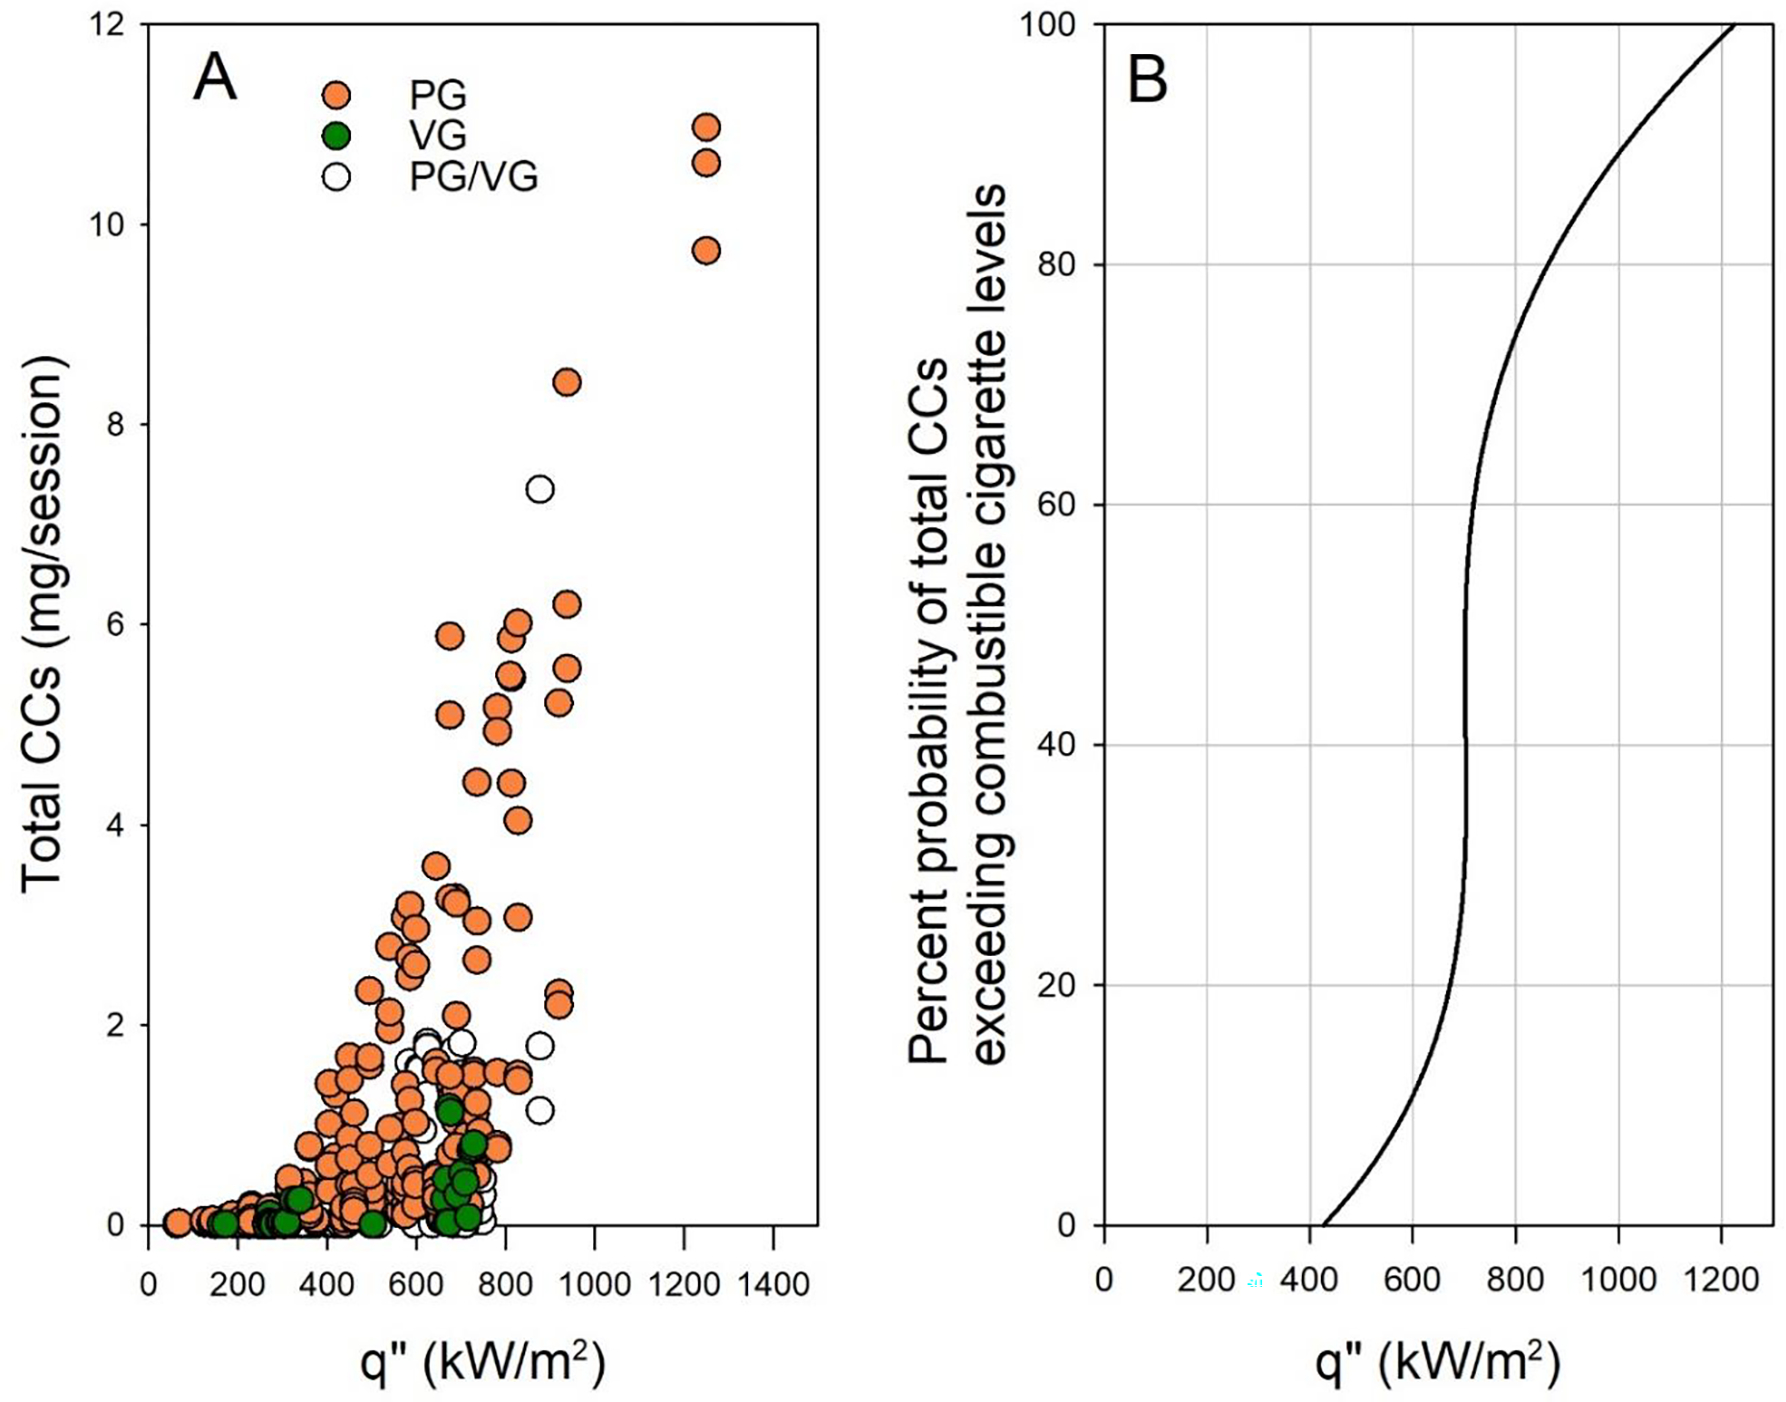
(A) Total carbonyls vs. q” for 25 ECIGs (N=431), 5 sub-Ohm and 20 above-Ohm devices, for powers ranging between 1–200W, ECIG coil surface area ranging between 7 and 283mm2, and PG/VG:100/0–0/100. PG and VG are color-coded. (B) A model that shows the percent probability that ECIG total carbonyls exceed combustible cigarette levels for a given q”. The model is built based on the empirical data in (A), smoothed using a 4th-degree polynomial fit.
This study was conducted to understand whether the phenomenon of film boiling can explain the onset of a high carbonyl emissions regime during electronic cigarette operation. We examined submerged electronic cigarette heating coil wires and electronic cigarette devices for evidence of film boiling at realistic powers with PG and VG liquids and a variety of materials and geometries. We found that when ECIG devices are powered at heat fluxes that approached the CHF determined by direct observation of submerged heating wires, the devices exhibited temperature excursions above the boiling point, accompanied by a plateau in the liquid vaporization rate, and a concomitant rise in CC emissions. These observations could not be the result of the wick running dry during high power operation because when we replaced PG with VG, a more viscous and more slowly wicking but higher CHF liquid, all signs of film boiling disappeared and carbonyl emissions dropped drastically. While manufacturers commonly instruct users to avoid high-temperature “dry puffs” during which the heating coil wick is insufficiently saturated, we found that manufacturer-recommended power ranges can lead to film boiling and excessive carbonyl emissions even when the wick is saturated. That is, when used as intended, ECIG devices can operate in a high-temperature film-boiling regime, leading to unnecessary exposure to toxicants. It has been argued that in real-world use, ECIG users detect and avoid high carbonyl emissions due to their associated unpleasant taste.23 However, high levels of formaldehyde and other carbonyls can be found in the exhaled breath condensates of ECIG users,31 indicating that ECIGs can expose users to high carbonyl emissions.
One limitation of this study is that only three devices were examined. To address this limitation, we compiled measurements of carbonyl emissions made by our group over the past 6 years for 25 commercially available devices (20 above-Ohm, and 5 sub-Ohm devices) that we characterized previously for power and heating coil surface area (range: 7–283 mm2). Figure 7A shows total carbonyls vs. q” for 431 samples from 103 different conditions in which power ranged from 1 to 200 W, flow rates were set at either 1 or 1.5 L/min, and puff duration was 4 s. Consistent with the observations in this study, CC yields rose precipitously when q” approached a value of 450 kW/m2. This value is near the mean CHF we found in the current study for nichrome heating wire with PG liquids. And as predicted by the CHF measurements with VG, carbonyl yields with VG liquids did not begin climbing until much higher values of q” (circa 700 kW/m2). Therefore, at least qualitatively, we see that historical data are consistent with the findings of this study: carbonyl emissions rise precipitously when q” exceeds CHF, and VG can reach substantially larger values of q” than PG prior to exhibiting HCR.
These findings therefore suggest that film boiling is a concern for a wide range of devices, and that ECIG heat flux should be limited to below the CHF to avoid unnecessary carbonyl exposure by users. As we have seen, however, CHF can vary widely even when the liquid and the heated surface are nominally identical, potentially due to variability in surface finish, among other factors. It may be more practical to regulate the maximum heat flux to a conservative value that is well below the theoretical CHF. For the data set presented in Figure 7A, we computed the probability that in 15 puffs, a given q” would result in carbonyl emissions that would exceed those of a combustible cigarette, approximately 2 mg.32 It can be seen in Figure 7B that for q” below 400 kW/m2, the probability was negligible. This may be a reasonable upper bound for regulation. For reference, based on our previous measurements of heating coil dimensions and maximum power output,32–33 the JUUL ECIG has a q” of approximately 215 kW/m2.
Another limitation of this study is that we examined only one class of toxicants produced by the pyrolysis of the ECIG liquids. The formation of other pyrolysis products found in ECIG aerosols, such as reactive oxygen species,4, 34–36 VOCs,(32) and CO,37 may become significant at heat fluxes lower than CHF.
CONCLUSION
This study demonstrates that high carbonyl emissions, a major class of respiratory toxicants, are intrinsic to electronic cigarettes when they are operated at a heat flux approaching or exceeding the CHF. ECIG manufacturers routinely recommend power levels that result in heat fluxes above the CHF. Constraining heat flux to below 400 kW/m2 can greatly reduce ECIG carbonyl emissions, without compromising nicotine yield.
Supplementary Material
Figure 6. Comparison between the wicking rates of PG and VG.
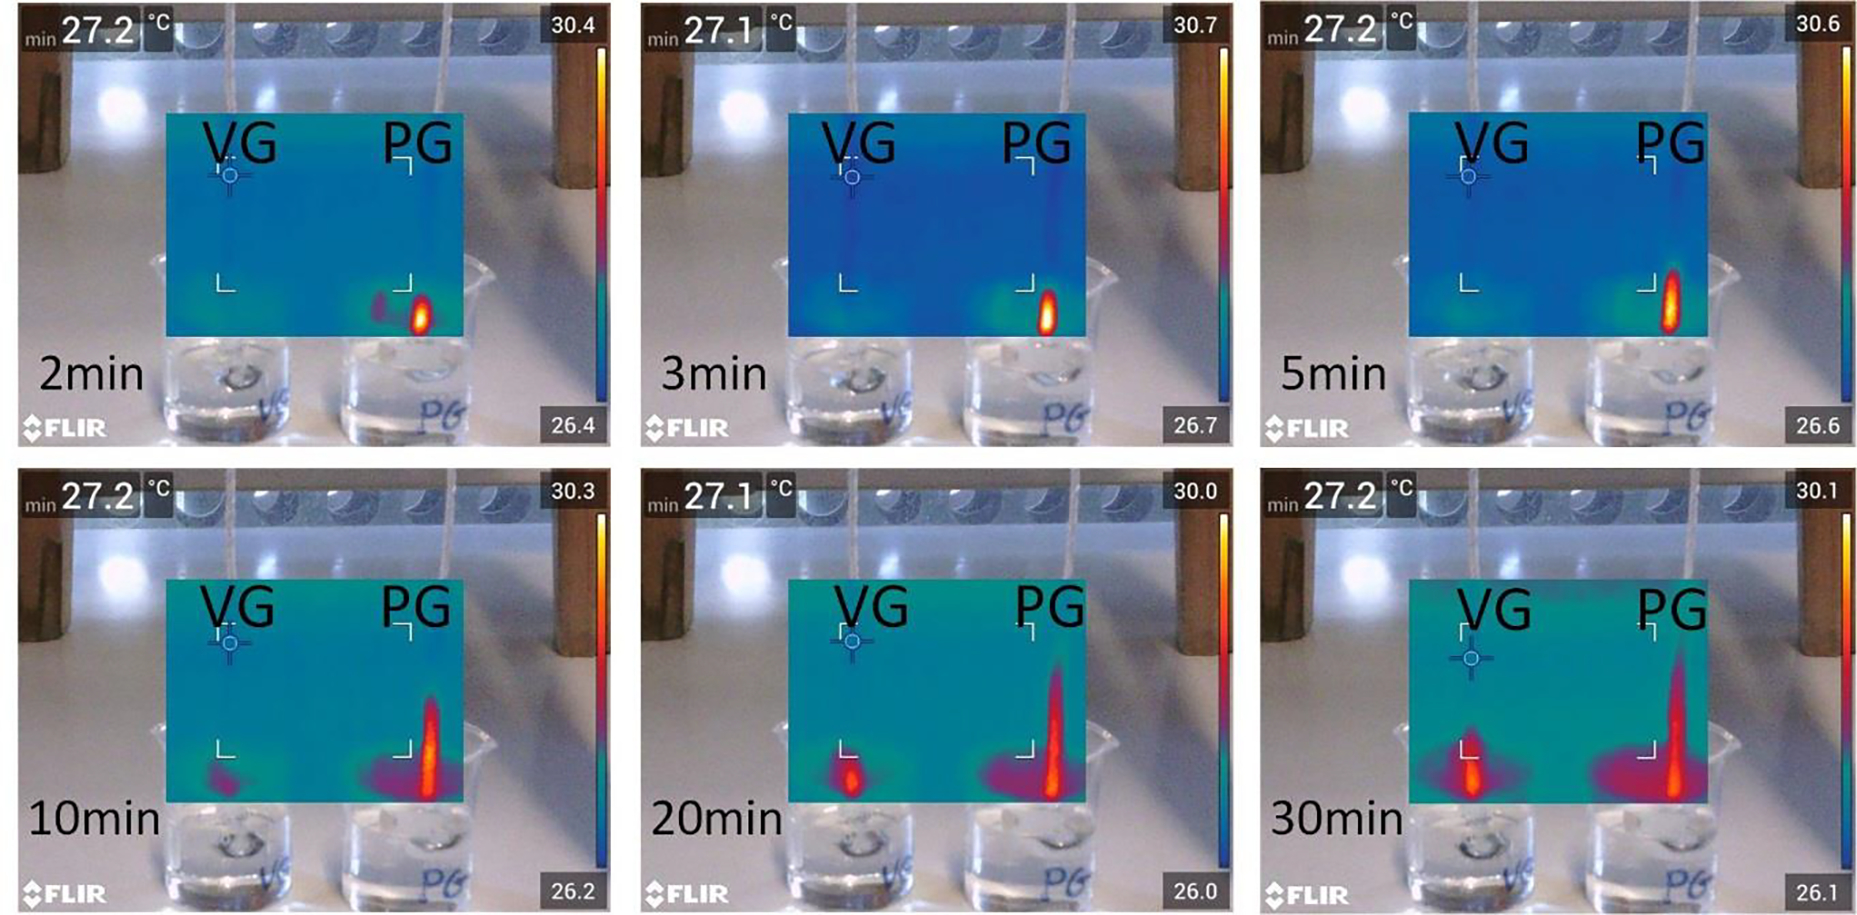
An IR camera continuously recorded the motion of PG and VG on silica wicks, partially submerged in PG and VG-filled beakers. The images show comparisons between the distances traveled by PG and VG with time.
Funding:
This research is supported by grant number U54DA036105 from the National Institute on Drug Abuse of the National Institutes of Health and the Center for Tobacco Products of the U.S. Food and Drug Administration. The content is solely the responsibility of the authors and does not necessarily represent the views of the NIH or the FDA.
Footnotes
Competing interests: AS is named on a patent application for a device that measures the puffing behavior of electronic cigarette users
Supporting information:
Supplementary text S1: Materials and Methods
Supplementary text S2: EScribe Suite© validation
Movie S1: Boiling regimes observed on a nickel wire submerged in a saturated PG solution
REFERENCES
- 1.El-Hellani A; Salman R; El-Hage R; Talih S; Malek N; Baalbaki R; Karaoghlanian N; Nakkash R; Shihadeh A; Saliba NA, Nicotine and Carbonyl Emissions From Popular Electronic Cigarette Products: Correlation to Liquid Composition and Design Characteristics. Nicotine Tob Res 2016, 20 (2), 215–223. [DOI] [PMC free article] [PubMed] [Google Scholar]
- 2.Goniewicz ML; Knysak J; Gawron M; Kosmider L; Sobczak A; Kurek J; Prokopowicz A; Jablonska-Czapla M; Rosik-Dulewska C; Havel C; Jacob P 3rd; Benowitz N, Levels of selected carcinogens and toxicants in vapour from electronic cigarettes. Tob. Control 2014, 23 (2), 133–9. [DOI] [PMC free article] [PubMed] [Google Scholar]
- 3.Hutzler C; Paschke M; Kruschinski S; Henkler F; Hahn J; Luch A, Chemical hazards present in liquids and vapors of electronic cigarettes. Arch. Toxicol. 2014, 88 (7), 1295–1308. [DOI] [PubMed] [Google Scholar]
- 4.Goel R; Durand E; Trushin N; Prokopczyk B; Foulds J; Elias RJ; Richie JP Jr., Highly reactive free radicals in electronic cigarette aerosols. Chem. Res. Toxicol. 2015, 28 (9), 1675–7. [DOI] [PMC free article] [PubMed] [Google Scholar]
- 5.Pankow JF; Kim K; McWhirter KJ; Luo W; Escobedo JO; Strongin RM; Duell AK; Peyton DH, Benzene formation in electronic cigarettes. PLoS One 2017, 12 (3), e0173055. [DOI] [PMC free article] [PubMed] [Google Scholar]
- 6.Fillon M, Electronic Cigarettes May Lead to Nicotine Addiction. JNCI Journal of the National Cancer Institute 2015, 107 (3), djv070–djv070. [DOI] [PubMed] [Google Scholar]
- 7.Schneider S; Diehl K, Vaping as a Catalyst for Smoking? An Initial Model on the Initiation of Electronic Cigarette Use and the Transition to Tobacco Smoking Among Adolescents. 2015, ntv193. [DOI] [PubMed] [Google Scholar]
- 8.Cooke A; Fergeson J; Bulkhi A; Casale TB, The Electronic Cigarette: The Good, the Bad, and the Ugly. J Allergy Clin Immunol Pract 2015, 3 (4), 498–505. [DOI] [PubMed] [Google Scholar]
- 9.IARC Formaldehyde. https://monographs.iarc.fr/wp-content/uploads/2018/06/mono100F-29.pdf (accessed 5/14).
- 10.Hoffmann D; Hoffmann I; El-Bayoumy K, The Less Harmful Cigarette: A Controversial Issue. A Tribute to Ernst L. Wynder. Chem. Res. Toxicol. 2001, 14 (7), 767–790. [DOI] [PubMed] [Google Scholar]
- 11.Jensen RP; Strongin RM; Peyton DH, Solvent Chemistry in the Electronic Cigarette Reaction Vessel. Sci. Rep. 2017, 7, 42549. [DOI] [PMC free article] [PubMed] [Google Scholar]
- 12.Saliba NA; El Hellani A; Honein E; Salman R; Talih S; Zeaiter J; Shihadeh A, Surface chemistry of electronic cigarette electrical heating coils: Effects of metal type on propylene glycol thermal decomposition. Journal of Analytical and Applied Pyrolysis 2018, 134, 520–525. [DOI] [PMC free article] [PubMed] [Google Scholar]
- 13.Bekki K; Uchiyama S; Ohta K; Inaba Y; Nakagome H; Kunugita N, Carbonyl compounds generated from electronic cigarettes. Int. J. Environ. Res. Public Health 2014, 11 (11), 11192–200. [DOI] [PMC free article] [PubMed] [Google Scholar]
- 14.Kosmider L; Sobczak A; Fik M; Knysak J; Zaciera M; Kurek J; Goniewicz ML, Carbonyl Compounds in Electronic Cigarette Vapors: Effects of Nicotine Solvent and Battery Output Voltage. Nicotine Tob Res 2014, 16 (10), 1319–1326. [DOI] [PMC free article] [PubMed] [Google Scholar]
- 15.Jensen RP; Luo W; Pankow JF; Strongin RM; Peyton DH, Hidden formaldehyde in e-cigarette aerosols. N. Engl. J. Med. 2015, 372 (4), 392–4. [DOI] [PubMed] [Google Scholar]
- 16.Talih S; Salman R; Karaoghlanian N; El-Hellani A; Saliba N; Eissenberg T; Shihadeh A, “Juice Monsters”: Sub-Ohm Vaping and Toxic Volatile Aldehyde Emissions. Chem. Res. Toxicol. 2017, 30 (10), 1791–1793. [DOI] [PubMed] [Google Scholar]
- 17.Ogunwale MA; Li M; Ramakrishnam Raju MV; Chen Y; Nantz MH; Conklin DJ; Fu X-A, Aldehyde Detection in Electronic Cigarette Aerosols. ACS Omega 2017, 2 (3), 1207–1214. [DOI] [PMC free article] [PubMed] [Google Scholar]
- 18.Uchiyama S; Ohta K; Inaba Y; Kunugita N, Determination of carbonyl compounds generated from the E-cigarette using coupled silica cartridges impregnated with hydroquinone and 2,4-dinitrophenylhydrazine, followed by high-performance liquid chromatography. Anal. Sci. 2013, 29 (12), 1219–22. [DOI] [PubMed] [Google Scholar]
- 19.Sleiman M; Logue JM; Montesinos VN; Russell ML; Litter MI; Gundel LA; Destaillats H, Emissions from Electronic Cigarettes: Key Parameters Affecting the Release of Harmful Chemicals. Environ. Sci. Technol. 2016, 50 (17), 9644–51. [DOI] [PubMed] [Google Scholar]
- 20.Herrington JS; Myers C, Electronic cigarette solutions and resultant aerosol profiles. J. Chromatogr. A 2015, 1418, 192–9. [DOI] [PubMed] [Google Scholar]
- 21.Geiss O; Bianchi I; Barrero-Moreno J, Correlation of volatile carbonyl yields emitted by e-cigarettes with the temperature of the heating coil and the perceived sensorial quality of the generated vapours. Int. J. Hyg. Environ. Health 2016, 219 (3), 268–77. [DOI] [PubMed] [Google Scholar]
- 22.Gillman IG; Kistler KA; Stewart EW; Paolantonio AR, Effect of variable power levels on the yield of total aerosol mass and formation of aldehydes in e-cigarette aerosols. Regul. Toxicol. Pharmacol. 2016, 75, 58–65. [DOI] [PubMed] [Google Scholar]
- 23.Farsalinos KE; Voudris V; Poulas K, E-cigarettes generate high levels of aldehydes only in ‘dry puff’ conditions [Epub ahead of print]. Addiction 2015. [DOI] [PubMed] [Google Scholar]
- 24.Zuber N Hydrodynamic Aspects of Boiling Heat Transfer. University of California, Los Angeles, CA, 1959. [Google Scholar]
- 25.Ghiaasiaan SM, Transition and Film Boiling. In Handbook of Thermal Science and Engineering, Kulacki F, Ed. Springer, Cham: 2017; pp 1–51. [Google Scholar]
- 26.Vassallo P; Kumar R; D’Amico S, Pool boiling heat transfer experiments in silica–water nano-fluids. International Journal of Heat and Mass Transfer 2004, 47 (2), 407–411. [Google Scholar]
- 27.Pitts CC; Leppert G, The critical heat flux for electrically heated wires in saturated pool boiling. International Journal of Heat and Mass Transfer 1966, 9 (4), 365–377. [Google Scholar]
- 28.Commerce, U. S. D. O., Bureau of Standards Journal of Research. Forgotten Books: 1930; Vol. 5. [Google Scholar]
- 29.Dhere NG; Sarma GH; Parikh NR, Low TCR Kanthal Resistive Films for Hybrid IC’s. Journal of Vacuum Science and Technology 1970, 7 (6), 588–592. [Google Scholar]
- 30.Talih S; Balhas Z; Salman R; Karaoghlanian N; Shihadeh A, “Direct Dripping”: A High-Temperature, High-Formaldehyde Emission Electronic Cigarette Use Method. Nicotine Tob Res 2016, 18 (4), 453–9. [DOI] [PMC free article] [PubMed] [Google Scholar]
- 31.Samburova V; Bhattarai C; Strickland M; Darrow L; Angermann J; Son Y; Khlystov A, Aldehydes in Exhaled Breath during E-Cigarette Vaping: Pilot Study Results. Toxics 2018, 6 (3), 46. [DOI] [PMC free article] [PubMed] [Google Scholar]
- 32.Talih S; Salman R; El-Hage R; Karam E; Karaoghlanian N; El-Hellani A; Saliba N; Shihadeh A, Characteristics and toxicant emissions of JUUL electronic cigarettes. Tob. Control 2019, 28 (6), 678–680. [DOI] [PMC free article] [PubMed] [Google Scholar]
- 33.Talih S; Salman R; El-Hage R; Karam E; Salam S; Karaoghlanian N; El-Hellani A; Saliba N; Shihadeh A, A comparison of the electrical characteristics, liquid composition, and toxicant emissions of JUUL USA and JUUL UK e-cigarettes. Sci. Rep. 2020, 010 (1), 7322. [DOI] [PMC free article] [PubMed] [Google Scholar]
- 34.Haddad C; Salman R; El-Hellani A; Talih S; Shihadeh A; Saliba NA, Reactive Oxygen Species Emissions from Supra- and Sub-Ohm Electronic Cigarettes. J. Anal. Toxicol. 2018, bky065–bky065. [DOI] [PMC free article] [PubMed] [Google Scholar]
- 35.Bitzer ZT; Goel R; Reilly SM; Bhangu G; Trushin N; Foulds J; Muscat J; Richie JP, Emissions of free radicals, carbonyls, and nicotine from the NIDA Standardized Research Electronic Cigarette and comparison to similar commercial devices. Chem. Res. Toxicol. 2018. [DOI] [PMC free article] [PubMed] [Google Scholar]
- 36.Bitzer ZT; Goel R; Reilly SM; Foulds J; Muscat J; Elias RJ; Richie JP, Solvent and Temperature Effects on Free Radical Formation in Electronic Cigarette Aerosols. Chem. Res. Toxicol. 2017. [DOI] [PMC free article] [PubMed] [Google Scholar]
- 37.El-Hellani A; Al-Moussawi S; El-Hage R; Talih S; Salman R; Shihadeh A; Saliba NA, Carbon Monoxide and Small Hydrocarbon Emissions from Sub-ohm Electronic Cigarettes. Chem. Res. Toxicol. 2019, 32 (2), 312–317. [DOI] [PubMed] [Google Scholar]
Associated Data
This section collects any data citations, data availability statements, or supplementary materials included in this article.


