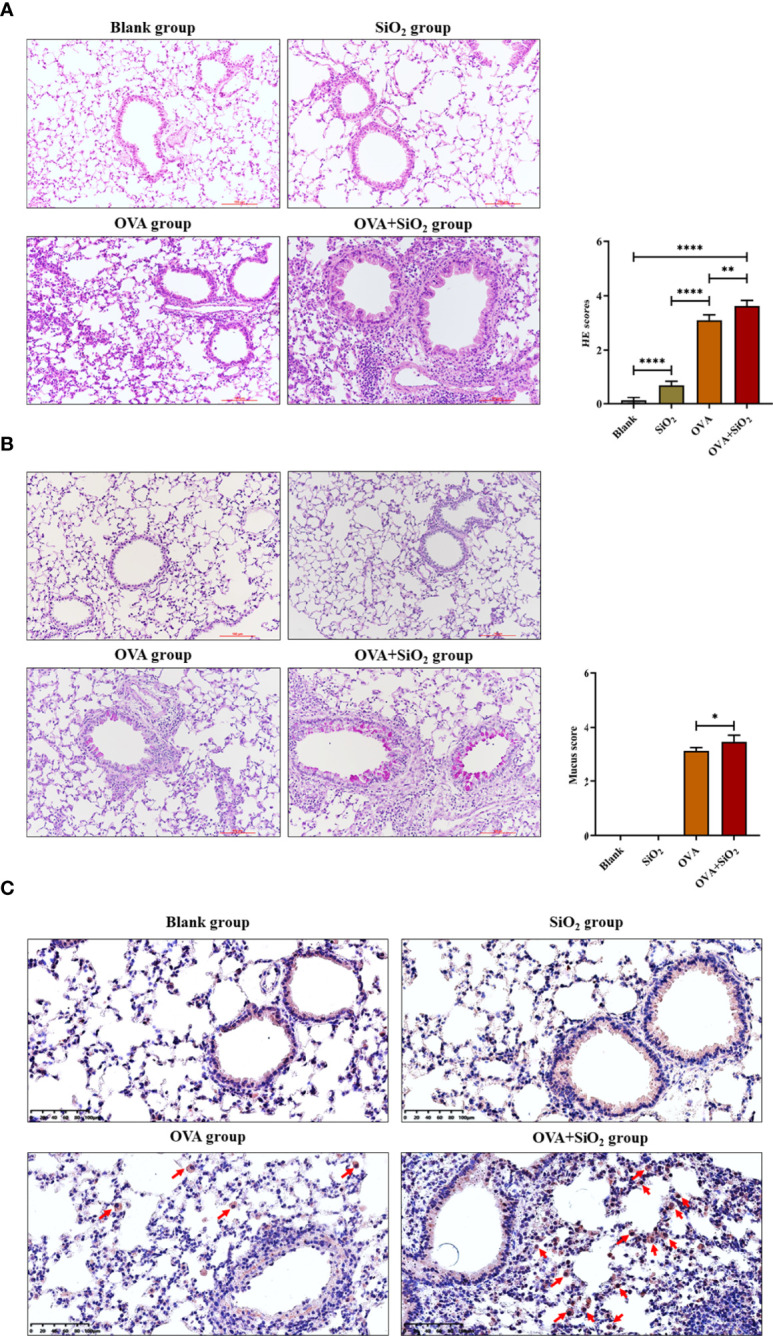
Figure 5.

Representative images of lung histology and immunohistochemistry. (A) Lung tissue stained with hematoxylin and eosin (H&E) (× 200). (B) Lung tissue stained with periodic acid-Schiff stain (PAS) (× 200). (C) Immunohistochemistry analysis of mast cell tryptase in lung tissue. The arrow indicates anti-mast cell tryptase antibody-positive cells. Data are represented as the means ± SD. The unpaired t test was used to compare different groups. *P < 0.05, **P < 0.01, ****P < 0.0001.
