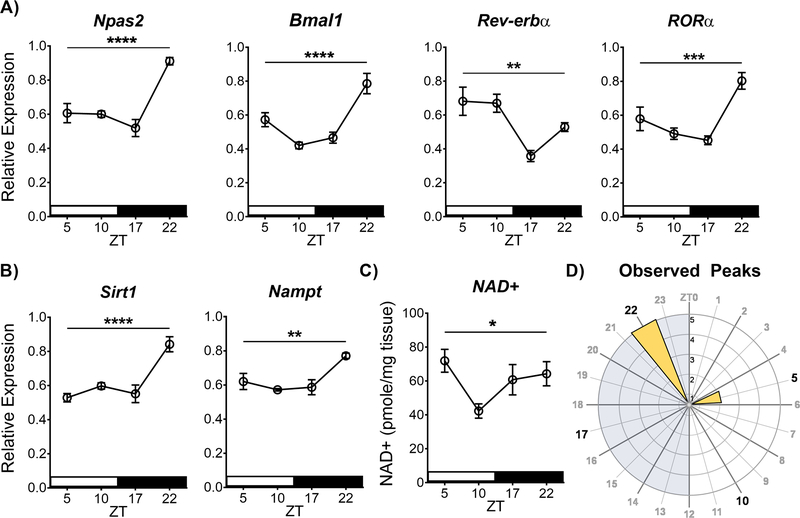
Figure 1. The molecular clock and regulators of cellular metabolic state show diurnal variation in the NAc.
(A) Core molecular clock gene expression of Npas2, Bmal1, Rev-erbα, and RORα show diurnal variation in the NAc, as well as the (B) metabolic genes Sirt1 and Nampt – measured using RT-qPCR. Relative expression normalized to the reference gene 18s. (C) HPLC analysis of NAD+ levels also shows diurnal variation in the NAc. (D) Rose plot of the observed peaks of expression illustrates peaks are primarily at ZT22 during the dark phase. Asterisks and bar indicate a significant main effect of time measured in a one-way ANOVA (* p<0.05, ** p<0.01, *** p<0.001, **** p<0.0001). NAc tissue was collected from saline-treated animals (14 days, i.p. at 10 ml/kg, between ZT4–8). Data represented as Mean ± SEM (n=5–6 / ZT). White stripe indicates lights on, black stripe indicates lights off. Grey shading on the rose plot indicates lights off, and the inset axis shows the number of genes. ZT 0 = 7 am.

