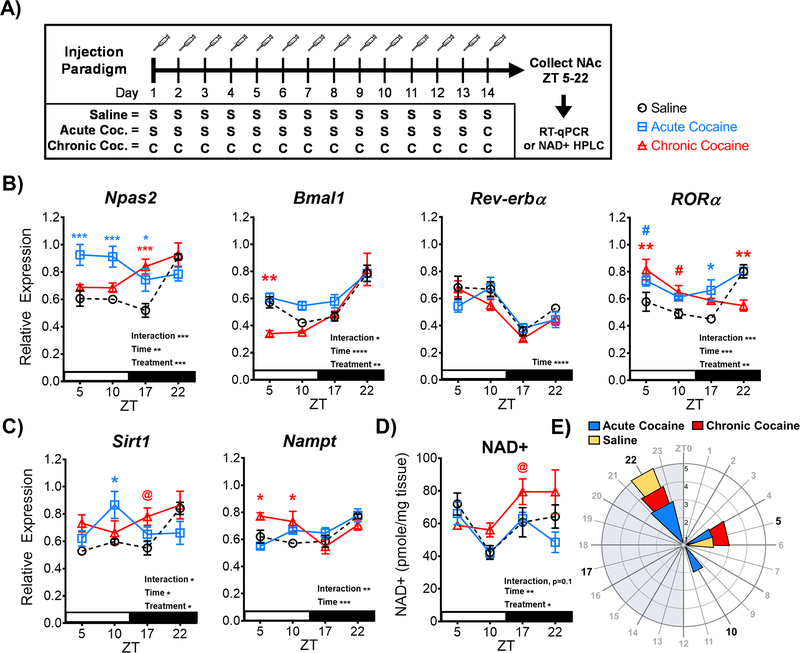
Figure 2. Cocaine exposure alters diurnal variation of the circadian molecular clock and cellular metabolic state in the NAc.
(A) Schematic outlining the 14-day injection paradigm. Mice were given either saline (S; 10 ml/kg, i.p.), chronic cocaine (C; 20 mg/kg, i.p.), or acute cocaine (A; 13 days x saline, 1-day x cocaine). NAc tissue was collected beginning 24 hours after the last injection for molecular assays. (B) Following cocaine exposure, diurnal variation of core molecular clock gene expression of Npas2, Bmal1, and ROR, as well as (C) the metabolic genes Sirt1 and Nampt, were significantly altered in the NAc – as indicated by significant interactions and main effects of time and/or treatment by 2-way ANOVA. (ROR blue #, p=0.0751; ROR red #, p=0.0732; Sirt1 @, p=0.0511). (D) HPLC analysis revealed cocaine exposure also significantly disrupts diurnal variation of NAD+ levels in the NAc, with significant main effects of time and treatment. (NAD+ @, p=0.0572). (E) Rose plot illustrates observed peaks in expression are primarily at ZT22 during the dark phase, but cocaine exposure advances more peaks of expression to the light phase. Saline data from Figure 1 are depicted as dotted lines for comparison purposes. Injections were administered between ZT4–8. White stripe indicates lights on, black stripe indicates lights off. Grey shading on rose plot indicates lights off, and the inset axis shows the number of genes. Asterisks, pounds, and at-signs above the plotted lines indicate a statistical difference relative to saline, revealed in a Bonferroni post-hoc analysis. Color of asterisk, pound, or at-sign corresponds to the treatment group compared. Data represented as Mean ± SEM (n=5–6 / ZT). (* p<0.05, ** p<0.01, *** p<0.001). ZT 0 = 7 am.

