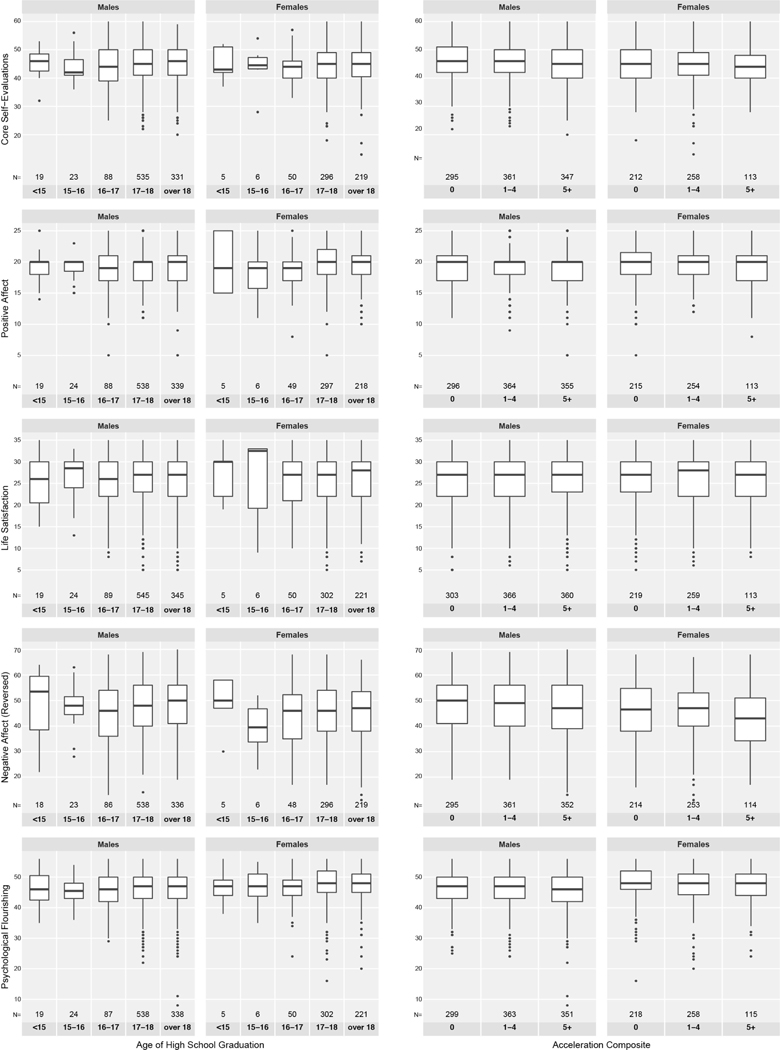
Box-and-whisker plots of the relationship between indicators of psychological well-being and age of high school graduation (first column pair) and the acceleration composite (second column pair) in Study 1. Sample sizes appear below the box. Horizontal lines represent medians; hinges represent the interquartile range (IQR); upper and lower whiskers extend to the furthest point within 1.5 × IQR from the median; all other data points are outliers.

An official website of the United States government
Here's how you know
Official websites use .gov
A
.gov website belongs to an official
government organization in the United States.
Secure .gov websites use HTTPS
A lock (
) or https:// means you've safely
connected to the .gov website. Share sensitive
information only on official, secure websites.
