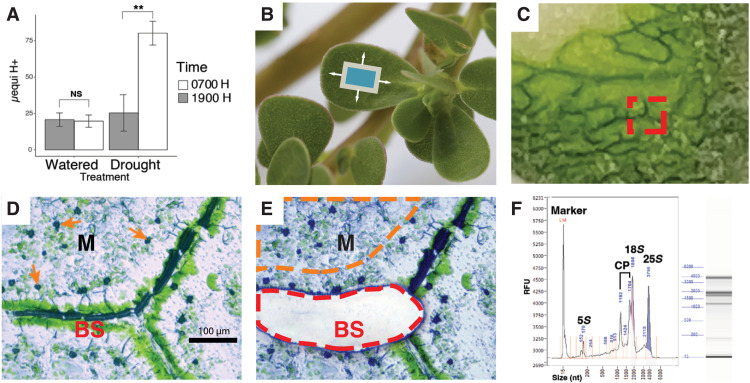
Fig. 1. Drought induction of CAM and laser capture microdissection.
(A) Diel fluctuation of titratable acidity from whole leaves of well-watered plants and after a 7-day drought treatment. NS, not significant. (B) P. oleracea, illustrating the orientation of paradermal sections (blue box). (C) Fresh, flash-frozen paradermal leaf section in cryosection block. The red square indicates an area used for tissue dissection. (D) Microphotograph of a 12-μm-thick leaf paradermal section indicating bundle sheath (BS) and mesophyll (M) tissues before (D) and after (E) BS cell capture. Orange arrows in (D) indicate calcium oxalate crystals in M cells. The red line in (E) indicates a laser-cut area of BS tissue, and the orange line illustrates an area of M tissue for laser capture. (F) RNA profile by electrophoresis for quality control. CP, chloroplast RNAs; RFU, relative fluorescence units.

