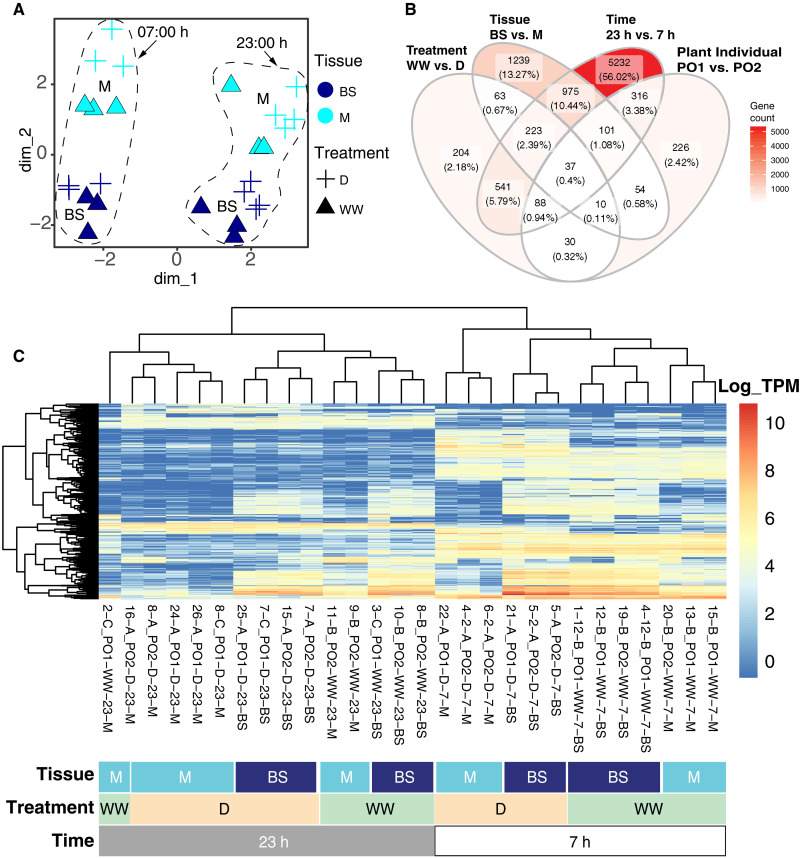
Fig. 2. Transcriptome-wide gene expression patterns across M and BS samples.
(A) All laser microdissection (LMD) samples projected into the first two dimensions of a transcriptome-wide multidimensional scaling analysis of log-transformed expression. Treatments: D, drought; WW, well-watered. (B) Venn diagram with number of DE genes across variables. (C) Heatmap with the log of gene expression of the 500 most variable genes across samples. Dendrograms cluster mRNA libraries (on the top) and genes (on the left) on the basis of gene expression similarities.

