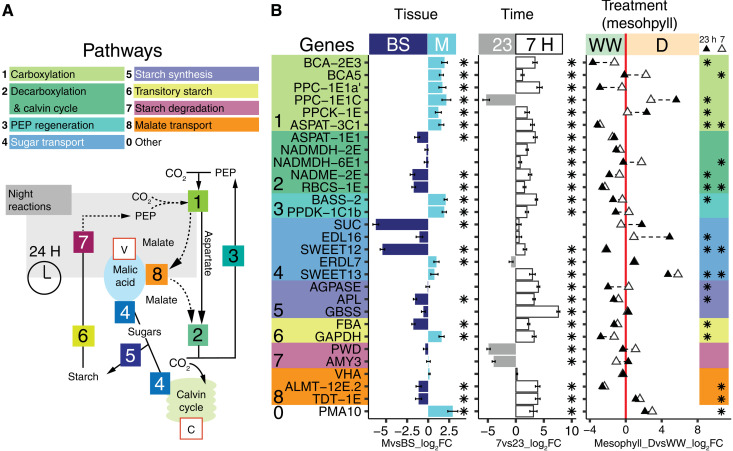
Fig. 3. Differential gene expression of M and BS across experimental conditions.
(A) Schematic of C4, CAM, and accessory biochemical pathways. Solid and dotted lines indicate C4 and CAM routes of carbon concentration, respectively; the gray box contains night reactions, and key substrates are shown (PEP). Intracellular compartments are indicated within red boxes (V, vacuole; C, chloroplast). (B) Differential transcript abundance (measured in log2FC) of selected genes in M relative to BS tissue (left) and at 7 hours relative to 23 hours (middle ) across LMD samples. Gene color backgrounds reflect pathways in (A). In the third panel, white triangles indicate log2FC of 7-hour M samples in D relative to 7-hour M samples WW. Black triangles indicate log2FC of 23-hour M samples in drought compared to 23-hour M samples WW. A triangle in the WW region (negative log2FC, left to the red line) indicates higher expression during WW, while triangles within the D region (right to the red line) indicate higher expression in D. In all panels, asterisks indicate DE significance (Padj < 0.05).

