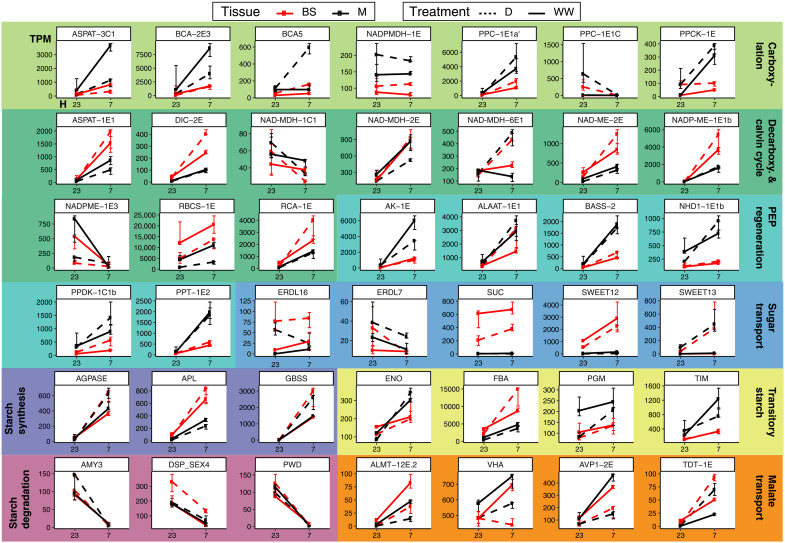
Fig. 4. Transcription abundance of selected CCM-related genes.
Median of transcripts per million (TPM; y axis) across time points (7 and 23 hours, x axis) in LMD mRNA libraries. Black and red lines indicate M or BS samples, respectively. Plain lines indicate watered, and dotted lines indicate drought. Error bars represent the interquartile range of expression.

