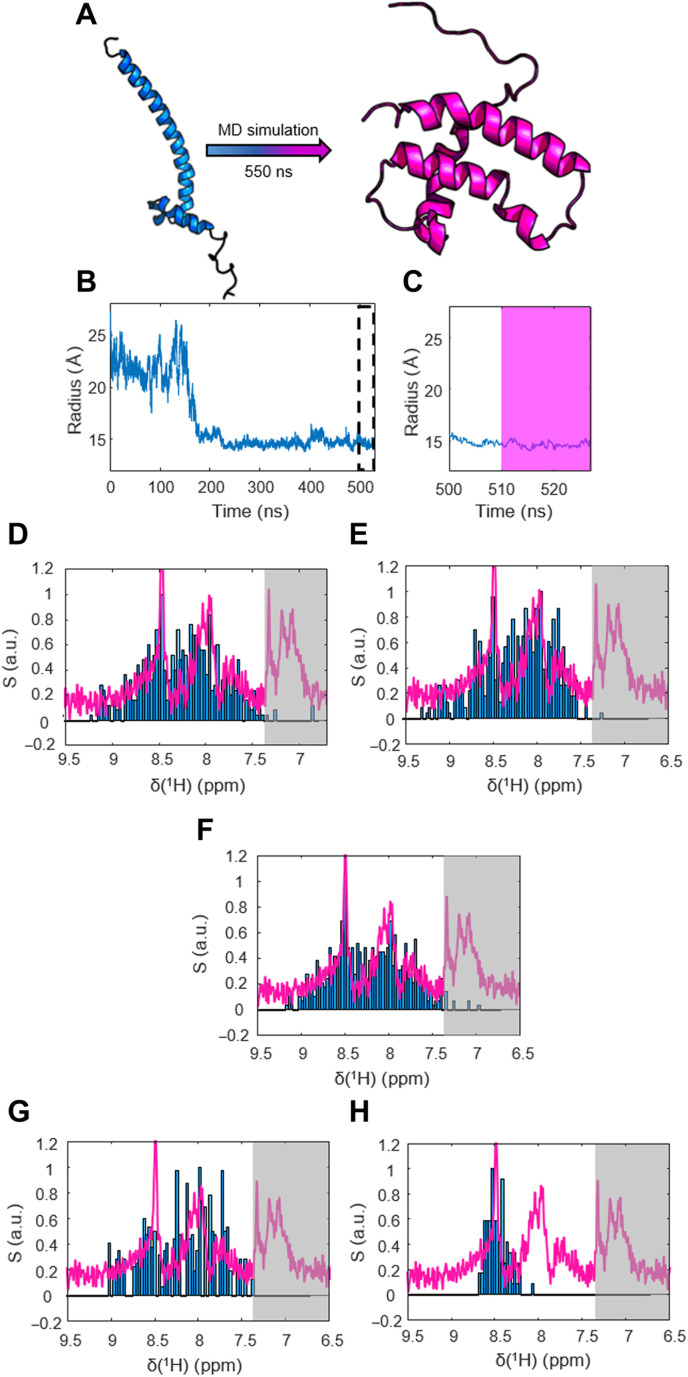
Fig. 2. Integration of MD simulations with the DDNP spectra.
(A) Structural transition observed for the MAX monomer in a 550-ns MD simulation in a 15 nm3 large box. Stripping the well-documented dimer of one subunit provided the starting structure. After 150 ns, a transition into a globular, tightly folded conformation could be observed. (B) Development of the hydration radius Rh of MAX in the MD simulations over time. After ~150 ns, MAX converts from the initial elongated shape into a compact conformation. The dashed box indicates the part of the simulation that we considered equilibrated and used for chemical shift predictions. (C) Zoom onto the Rh trajectory and the last 30 ns of the simulation. All conformations used for chemical shift prediction stem from the last 20 ns of simulation, highlighted in pink. (D to F) Comparison of the hyperpolarized spectrum (S) (pink line; average over the first 20 detected spectra) and the spectrum predicted on the basis of the MD simulations (blue bars) of the MAX monomer for three independent runs. The gray shade indicates side-chain resonances not included in the chemical shift calculations. The good match between the experimental and the calculated spectrum supports our conclusion that the monomer dominates the conformational ensemble at low concentrations. (G) “Negative control” comparing the experimental hyperpolarized spectrum with a spectrum predicted from the elongated MAX dimer structure. The mismatch shows that the experiment does not reflect this structure. (H) Negative control comparing the experimental hyperpolarized spectrum with a spectrum predicted for a random-coil state. The mismatch shows that the experiment does not reflect this structure either.

