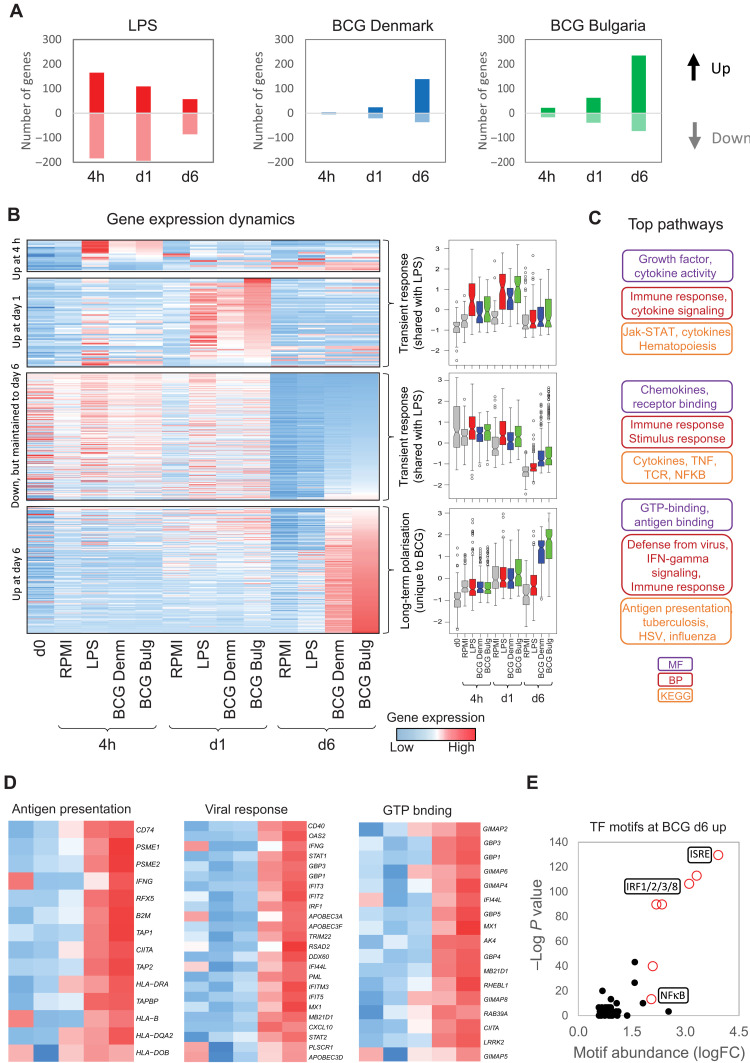
Fig. 2. BCG exposure induces both transient and longer-term transcriptional signatures.
(A) Bar plot showing the number of genes that are up-regulated (positive values) or down-regulated (negative values) in response to LPS or BCG Denmark or BCG Bulgaria at 4 hours, 1 day, and 6 days after exposure. (B) Heatmap and box plots of differentially expressed genes in response to BCG Denmark or BCG Bulgaria over time. There are two distinct sets of transcriptional dynamics: a transient up-regulation of 77 genes within the first 24 hours that is shared between BCG- and LPS-exposed monocytes, and a delayed transcriptional up-regulation of 416 genes at day 6 (5 days after stimulation) that is specific to BCG-exposed macrophages. Box plots are mean-centered RPKM values and show median, 25th, and 75th quartiles (gray, RPMI; red, LPS; blue, BCG Denmark; green, BCG Bulgaria). (C) Gene ontology analysis shows that the transient transcriptional response is related to cytokine release and nuclear factor κB (NFκB) signaling, while the delayed response is related to IFN signaling and response to virus. MF, molecular function; BP, biological process; KEGG, Kyoto Encyclopedia of Genes and Genomes. (D) Heatmap of specific gene sets that show BCG-specific up-regulation at day 6 involved in antigen presentation, viral responses [e.g., guanylate-binding proteins (GBPs)], and guanosine triphosphate (GTP) binding. (E) Scatter plot of −log10 P value (y axis) and fold change abundance (x axis) of a motif relative to background occurrence. Motif analysis identified the ISRE as enriched in the promoters of genes that show BCG-specific up-regulation at day 6.

