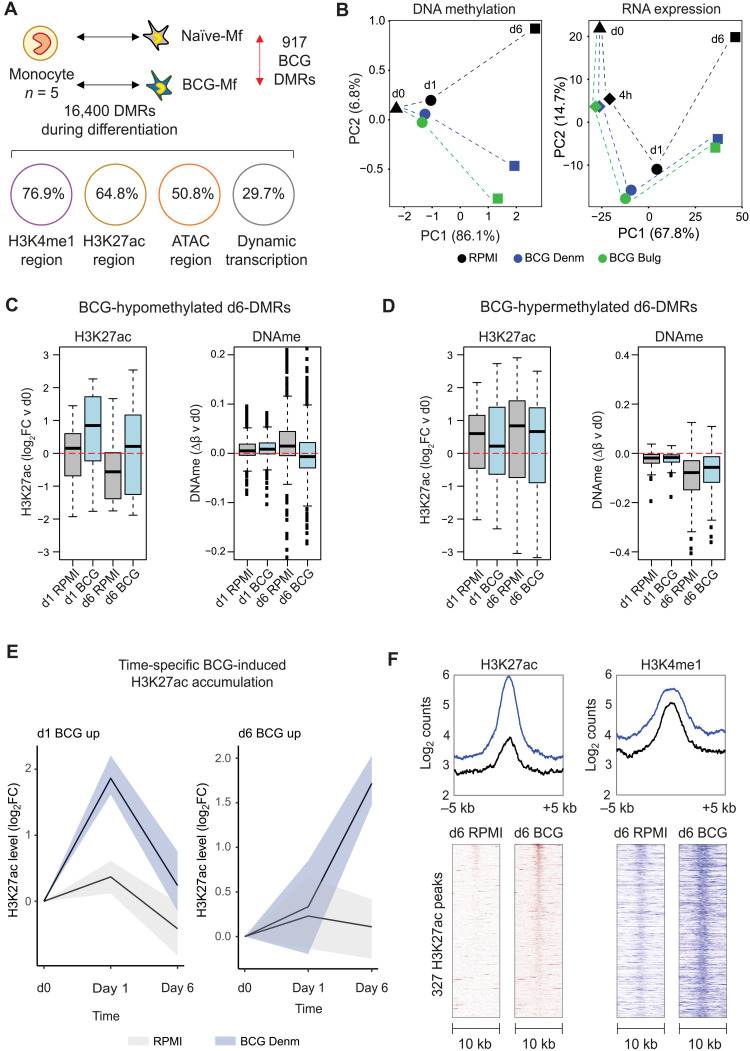
Fig. 3. BCG-induced DNA methylation signature is preceded by posttranslational histone modification remodeling.
(A) DNA methylation was profiled at days 0, 1, and 6 following BCG exposure, and 16,400 DMRs were related to monocyte-to-macrophage differentiation. A total of 77 and 917 DMRs were identified in both BCG Denmark– and BCG Bulgaria–exposed monocytes and macrophages at days 1 and 6, respectively. The 917 DMRs were linked to protein-coding genes, of which 29.7% were differentially expressed during differentiation and 5.6% were induced by BCG. In terms of chromatin marks, DMRs overlapped most strongly with H3K4me1 and H3K27ac regions, and to a lesser extent open chromatin [assay for transposase-accessible chromatin (ATAC) peaks]. (B) Principal components analysis (PCA) plot based on BCG-associated DNA methylation and transcriptional changes. In both datasets, differentiation is seen on PC1 and effect of BCG on PC2, with the BCG effect most clear at day 6. (C and D) Box plots showing change in H3K27ac signal and mean DNA methylation levels at DMRs. (C) At BCG-hypomethylated DMRs, BCG-Mfs show lower DNA methylation compared to RPMI-Mf, which is preceded by an accumulation of H3K27ac signal at day 1 in BCG-exposed macrophages. (D) At BCG-hypermethylated DMRs, the H3K27ac level in BCG-exposed cells is lower than in RPMI-exposed cells at day 1. (E) Line plots showing H3K27ac signal over time in RPMI-exposed (gray) and BCG Denmark–exposed (blue) monocytes (line, median; shaded area, 25th and 75th quartile). Two distinct sets of peaks are identified: those that peak at day 1 (170 peaks) and those that peak at day 6 (379 peaks). (F) Enriched heatmaps of BCG-Mf day 6 increased H3K27ac peaks and the corresponding H3K4me1 signal at the same peaks. Both H3K27ac and H3K4me1 show elevated levels compared to RPMI-exposed cells. Heatmaps show the center of the peak ± 5 kb.

