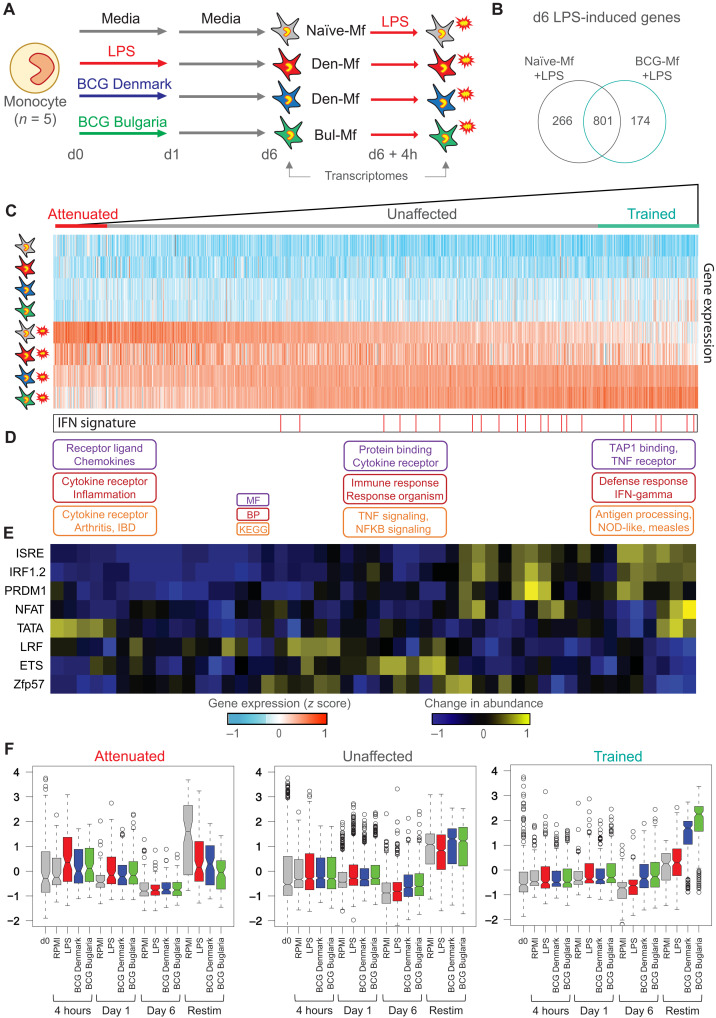
Fig. 4. Transcriptional response to LPS reexposure in BCG-trained macrophages.
(A) TRIM model, including data collection at 4-hour LPS reexposure at day 6. (B) Venn diagram showing overlap of genes induced by LPS restimulation at day 6 in Naïve-Mf and BCG-Mf. (C) The total macrophage transcriptional response (1242 genes) to LPS was ranked based on the induction of genes in BCG-Mfs (mean of Denmark-Mf and Bulgaria-Mf), relative to Naïve-Mfs, revealing a gradient in BCG-Mf response to LPS reexposure from trained to attenuated. Heatmap shows Naïve-Mf, LPS-Mf, and BCG-Mf at day 6 and after LPS exposure. (D) Gene ontology terms related to attenuated, unaffected, and trained genes, showing enrichment of IFN and viral responses on the unaffected and trained genes. (E) Motif enrichment analysis was performed on promoter regions using a sliding window of 60 genes from trained to attenuated. This analysis shows enrichment of IRF and PRDM1 motifs at trained genes. (F) Box plot showing gene expression over time for 100 attenuated, 946 unaffected, and 196 trained genes for Naïve-Mfs (gray), BCG Denmark-Mf (blue), BCG Bulgaria-Mf (green), and LPS-Mf (red). P values between genes in Naïve-Mf Restim group compared to other exposures within the attenuated gene set (LPS-Mf, P = 9.02 × 10– 5; Denmark-Mf, P = 5.86 × 10⁻⁸; Bulgaria-Mf, P = 1.56 × 10⁻¹⁵), within the equal gene set (LPS-Mf, P = 0.068; Denmark-Mf, P = 1; Bulgaria-Mf, P = 1), and within the trained group (LPS-Mf, P = 0.27; Denmark-Mf, P = 6.6 × 10–42; Bulgaria-Mf, P = 3.37 × 10–61).

