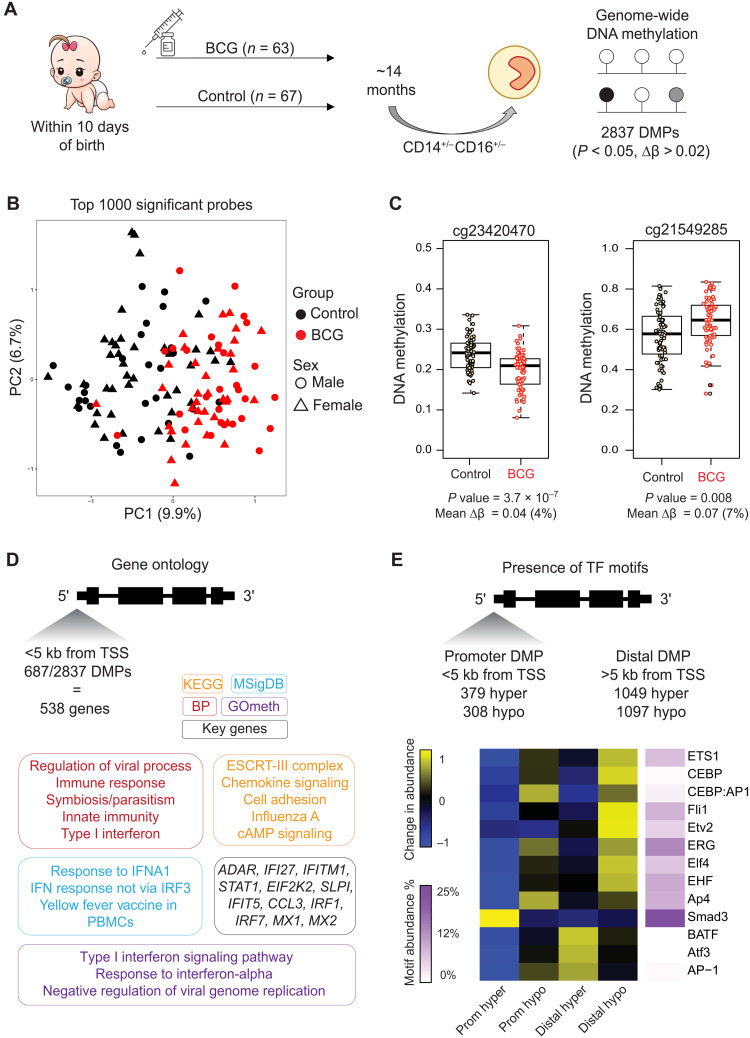
Fig. 6. EWAS identifies BCG-associated DNA methylation signature in circulating monocytes 14 months after vaccination.
(A) MIS BAIR clinical trial and experimental setup. Blood was collected from infants in the BCG-vaccinated group (n = 63) or non–BCG-vaccinated group (n = 67) on average 14 months after neonatal randomization (range, 12 to 24 months). Monocytes were sorted from peripheral blood mononuclear cells, and DNA methylation was quantified. A total of 2837 DMPs were identified. (B) PCA plot of the top 1000 DMPs shows a clear separation between the BCG-vaccinated (red) and non–BCG-vaccinated (black) groups on PC1. (C) Box plot and dot plot of DNA methylation for individual nonvaccinated and BCG-vaccinated samples at two probes with the lowest P value and highest contribution to PC1 in (B). (D) Gene ontology analysis was performed on 538 genes that had a promoter DMP. Gene-based (KEGG, BP, and MF) ontology analysis was performed with HOMER and showed agreement with CpG-based ontology analysis (GOmeth tool). Top genes were involved in IFN and viral responses. (E) Motif scanning identified distinct enrichment at promoter and distal DMPs. ETS family motifs were enriched at both promoter and distal hypomethylated DMPs, while ATF3 was enriched at distal hypermethylated DMPs.

