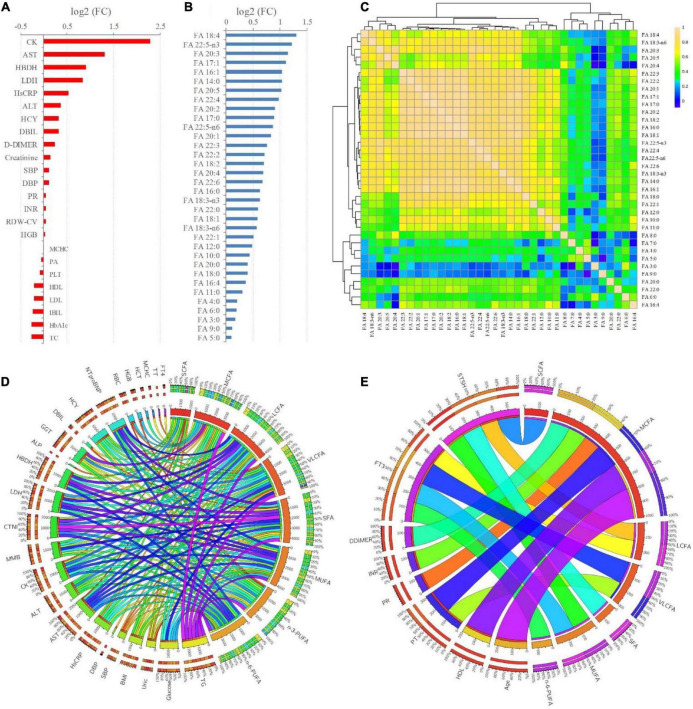
FIGURE 3.
(A,B) FCs (T2DM-CHD/T2DM) of the significantly changed (P < 0.05) clinical indicators and FFAs existed between T2DM and T2DM-CHD groups, respectively. (C) Spearman’s rank correlation analysis of the FFAs. (D,E) Significant positive and negative correlations (P < 0.05) existed between FFAs and clinical indictors, respectively.

