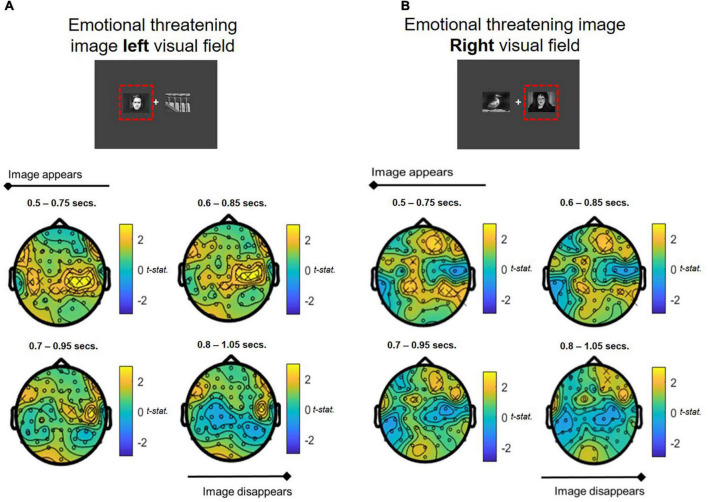
FIGURE 7.
Theta band power differences between COMBINED and PLACEBO treatments during presentation of emotionally threatening and neutral images when stress images shown in (A) LEFT and (B) RIGHT visual fields. Values > 0 indicate COMBINED treatment theta values are higher than PLACEBO treatment. Significant electrodes (p < 0.05) marked with an x. Each figure depicts a series of T-tests along the time course of the presentation of the images (0.5–1.05 s, in 0.1 s steps, 0.25 s sample widths).

