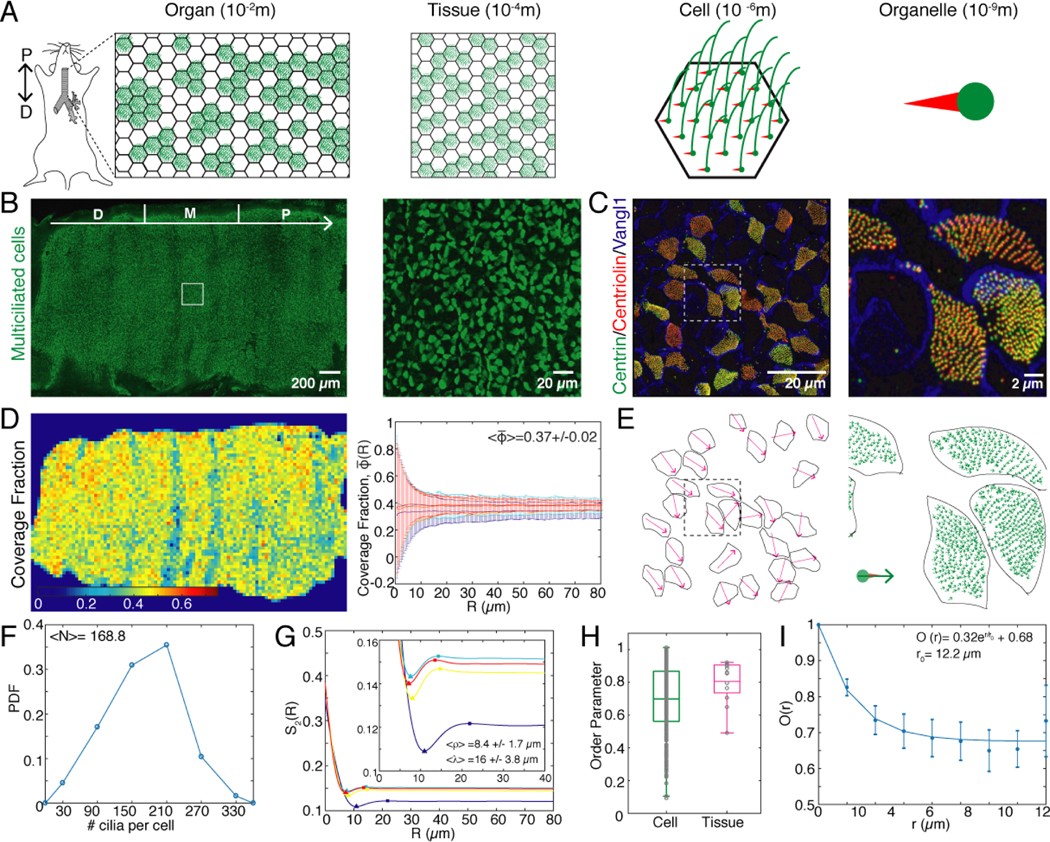
FIG. 1. Heterogeneity in spatial patterning of cilia in the mouse airway epithelium.
A. Schematic of the organisation of multiciliated cells across spatial scales. Thousands of multiciliated cells line the trachea, forming a “patchwork” pattern at the tissue scale. Each multiciliated cell contains hundreds of cilia anchored to the cell by the basal body. B. Fluorescence image of an entire trachea where multiciliated cells are labelled by Centrin-GFP. The distal, medial and proximal (D|M|P) segments of the organ, each one third, are indicated by white separation marks. The direction of fluid transport is D→P (lung→oral). Right: Magnification of region outlined by the white square. C. Fluorescence image of a section of the multiciliated epithelium. Vangl1 localizes to cell membranes. Fluorescently labelled Centrin and Centriolin mark individual basal bodies. The vector that connects Centriolin→Centrin defines the orientation of an individual cilium. Right: Magnification of region outlined by the white square. D. Heat map of the coverage fraction of multiciliated cells (). Right: Coverage fraction measured in circular non-overlapping windows of radius R, uniformly distributed along the trachea. is the average over all R and all tracheas imaged. E. Tissue scale orientation field obtained by averaging the orientation of cilia within each multiciliated cell shown in C. Right: Orientation of individual cilia shown in panel C. F. Probability density function of the number of cilia measured in 375 multiciliated cells. G. Plot of the spatial correlation function, S2, of the pattern of multiciliated cells. Inset: Magnified region where the minima and maxima of S2(R) occur. Triangles mark the minimum, which corresponds to the typical diameter of a cell ρ, while squares mark the maximum which corresponds to the wavelength of the patchwork pattern λ. H. Orientational order parameter m calculated for multiciliated cells (green) and tissue-scale orientational order parameter M (magenta). I. Spatial correlation function of the cellular scale orientation . The orientation of cilia in the jth cell is compared to the orientation in the cells that are at a distance less than or equal to r. Points show the measured values while solid line is the exponential fit.

