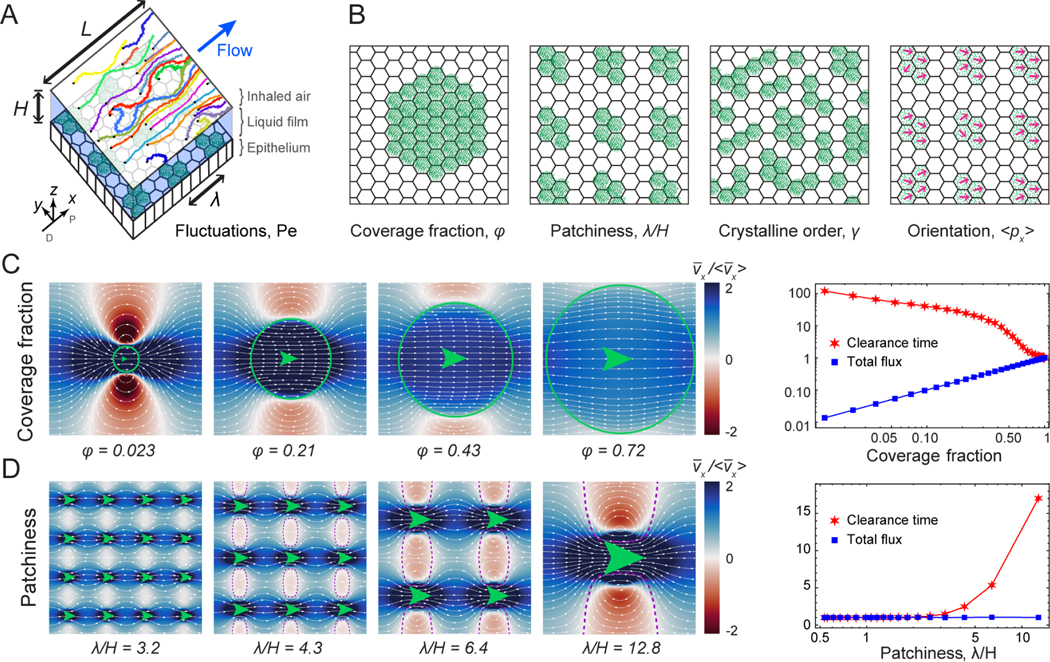
FIG. 3. Hydrodynamic model for particle flux and clearance.
A. Diagram of simulation geometry. A pattern of multiciliated cells (green) drives a liquid film flow (blue) in a 3D computational fluid dynamics (CFD) simulation with periodic boundary conditions in x and y. Particle trajectories with random initial positions are subject to this flow and fluctuations. B. Total flux and clearance times are examined as a function of ciliary organisation, characterised by the coverage fraction φ, wavelength λ, crystallinity γ, and orientation order . C. Higher coverage fractions improve clearance. Left: Shown are streamlines (white) and the longitudinal flow strength (red-blue) as a function of coverage fraction . Green circles indicate the area covered by cilia and green arrows their orientation. Right: Corresponding plot of clearance time and total flux, normalised with respect to full coverage, showing the mean of an ensemble of Np = 104 particle trajectories. D. Patchiness induces recirculation and slows clearance. Left: Flows as a function of wavelength λ. Dashed purple lines are separatrix streamlines that isolate recirculation zones (red) from the main currents (blue). Right: Corresponding clearance time and flux, normalised with respect to uniform coverage, again averaged over Np = 104 particle trajectories.

