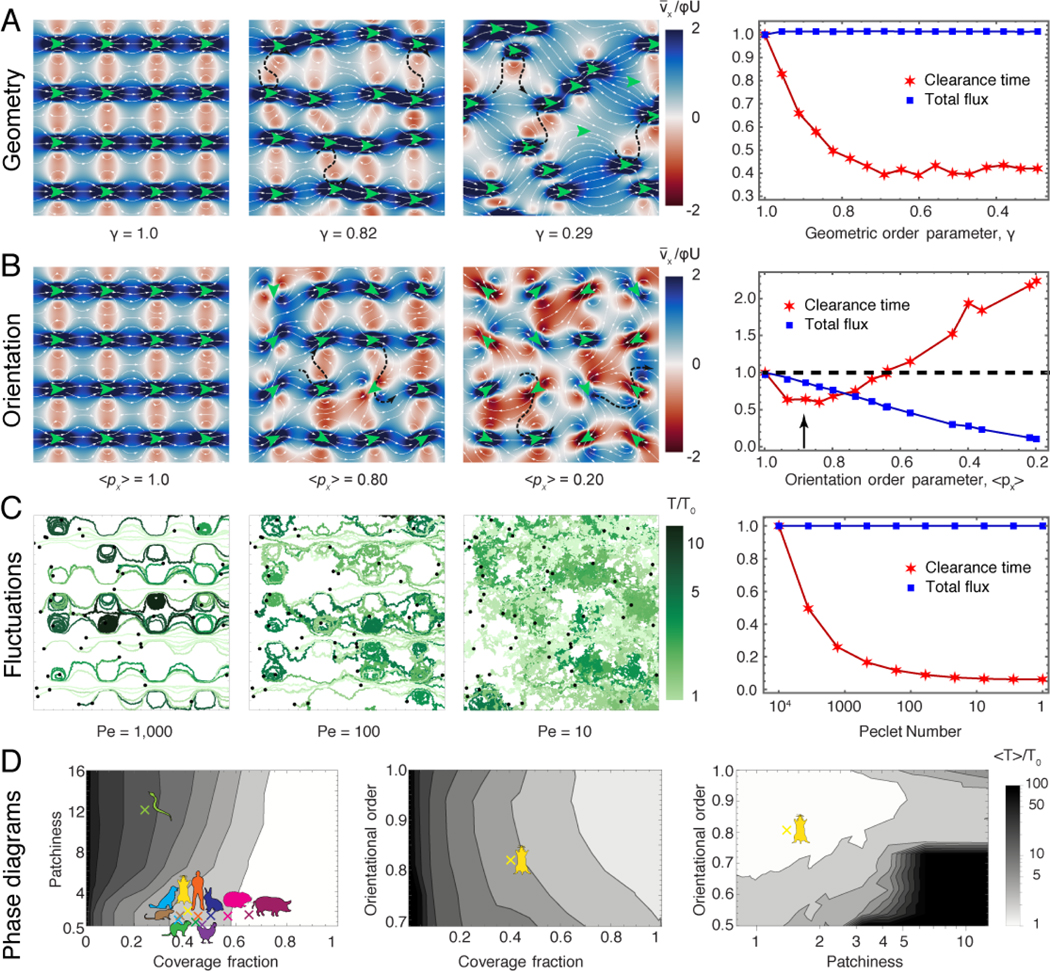
FIG. 4. Disorder improves clearance in heterogeneous epithelia.
A. Left: Flow strength along the D-P axis (red-blue) and streamlines (white) as a function of crystallinity γ. Green arrows indicate the position and orientation of the cilia patches. A few typical (black dashed) streamlines are shown to cross through recirculation areas. Right: Corresponding total flux and clearance time, normalised with respect to crystalline order. Np = 103 particle trajectories. B. Flow and clearance as a function of cilia orientational order . Same as (A) otherwise. C. Left: Particle trajectories subject to flow and diffusion for a range of Péclet numbers, . Right: Corresponding total flux and clearance time, normalised with respect to weak fluctuations. Np = 104 particle trajectories. D. Phase diagrams showing clearance time (grey scale, defined in legend) for the combinations of , with constant M = 1, λ/H = 8 and , respectively. The mouse cartoon indicates the measurements for the mouse epithelium. Other coloured cartoons on the first panel show values of patchiness and coverage fraction measured for several different animals, from data available in the literature (See Methods §2g and Figure S7).

