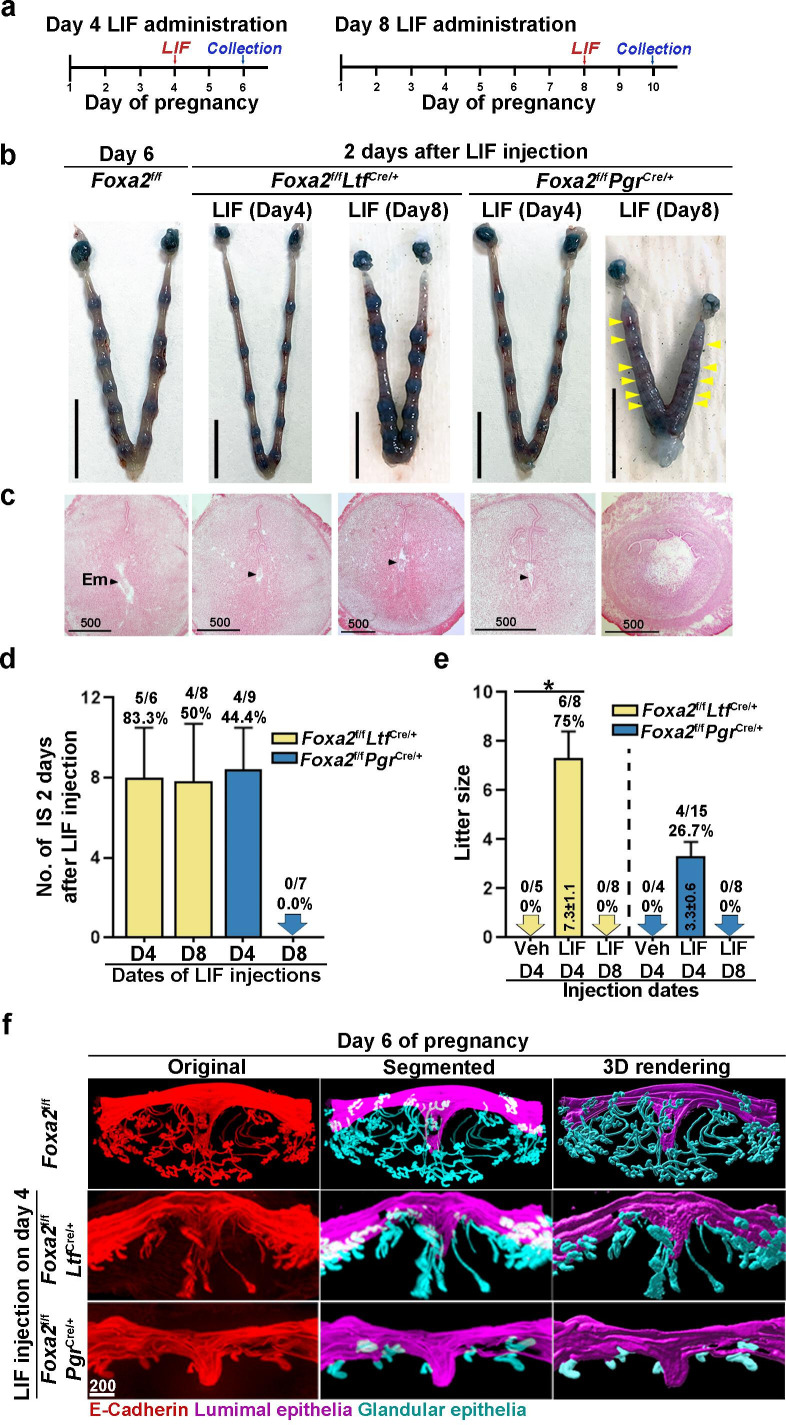
Figure 4. Pregnancy in Foxa2f/fLtfCre+ and Foxa2f/fPgrCre+ females with leukemia inhibitory factor (LIF) treatment.
(a) Schematic outline of sample collection. LIF, LIF administration (20 μg). (b) Representative photograph of uteri from Foxa2f/fLtfCre+ and Foxa2f/fPgrCre+ females (days 6 and 10) with LIF treatment. Foxa2f/f uteri on day 6 serve as control. Scale bar: 10 mm. Histological pictures of implantation sites in panel b were presented in panel c. Arrowheads point to embryos. Em, embryo. Scale bar: 500 μm. (d) Average number of implantation sites in Foxa2f/fLtfCre+ and Foxa2f/fPgrCre+ mice treated with LIF (20 μg) on day 4 or 8 of pregnancy. Numbers and percentage on bars indicate mice with implantation sites over total number of mated mice. (e) Litter sizes of Foxa2f/fLtfCre+ and Foxa2f/fPgrCre+mice treated with LIF (20 μg) or vehicle on days 4 or 8 of pregnancy. Numbers and percentage on bars indicate mice with pups over total number of mated mice. *p<0.05. (f) 3D visualization of day 6 implantation sites in Foxa2f/f, Foxa2f/fLtfCre+, and Foxa2f/fPgrCre+females. Images of E-cadherin immunostaining, segmented, and 3D rendered images of day 6 implantation sites in each genotype show defects in Foxa2f/fPgrCre+ females with a LIF injection on day 4 of pregnancy. Scale bar: 200 μm.

