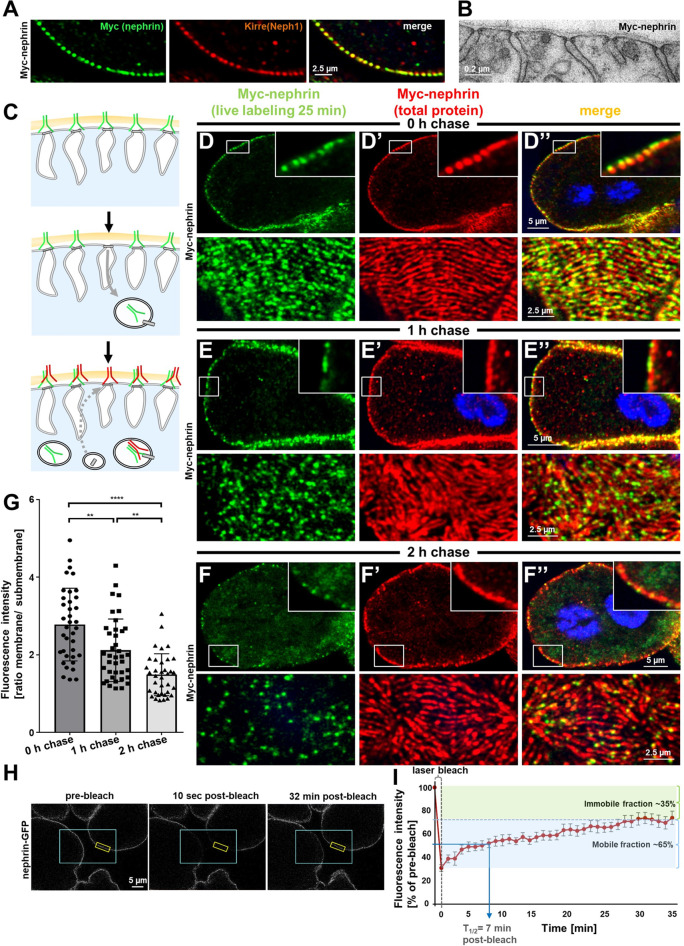
Figure 2. Live antibody labeling shows rapid nephrin turnover.
(A) Immunostaining of nephrocyte expressing Myc-nephrin homozygously shows colocalization with endogenous Neph1. (B) Transmission electron microscopy of a nephrocyte expressing Myc-nephrin homozygously reveals regular slit diaphragms suggesting the tagged protein is functional. (C) Schematic illustrating live antibody labeling: Living nephrocytes are labeled with anti-Myc antibody (green) that may undergo endocytosis during chasing. Total nephrin stain follows after fixation and permeabilization (red). Colocalization of green and red indicates stable nephrin (surface) or endocytosed nephrin (subcortical). Exclusively green signal indicates antibody dissociation, while new nephrin reaching the surface during the chase period will stain only red. (D) Confocal microscopy images show cross sections (top) and tangential sections (bottom) from Myc-nephrin nephrocytes after live antibody labeling without chasing. Extensive colocalization indicates successful nephrin labeling. Nuclei are marked by Hoechst 33342 in blue here and throughout the figure. (E) Confocal images analogous to (D) but after 1 hr of chasing reveal incipient endocytosis. (F) Confocal images analogous to (D–D’’) but after 2 hr of chasing suggest extensive endocytosis. Diffuse intracellular signal from live labeling suggests that internalized antibody separated from nephrin. Exclusively red nephrin signal indicates newly delivered protein. (G) Quantitation of fluorescence intensity derived from live labeling from conditions in (D–F) expressed as a ratio of surface (slit diaphragm) and subcortical areas confirms significant nephrin turnover (mean ± standard deviation, n=12–13 animals per p<0.01 for chase of 1 hr and p<0.0001 for 2 hr). (H) Shown are frames from a time lapse movie of nephrin-GFP nephrocytes. The blue box demarcates the region of photobleaching, the yellow box outlines a region of interest (ROI) where the fluorescence intensity was measured over the length of the fluorescence recovery after photobleaching (FRAP) experiment. A loss of fluorescence intensity compared to pre-bleach condition (left panel) is detectable 10 s after photobleaching (middle panel). After 32 min, the fluorescence recovers significantly (right panel). (I) Quantitative analysis from multiple FRAP experiments (n=5 cells, 8 ROIs total, mean ± standard deviation) reveals an initially rapid recovery of fluorescence intensity that slows to a plateau suggesting a nephrin half-life of ~7 min. The majority of nephrin molecules (~65%) are replaced within 30 min (mobile fraction).


