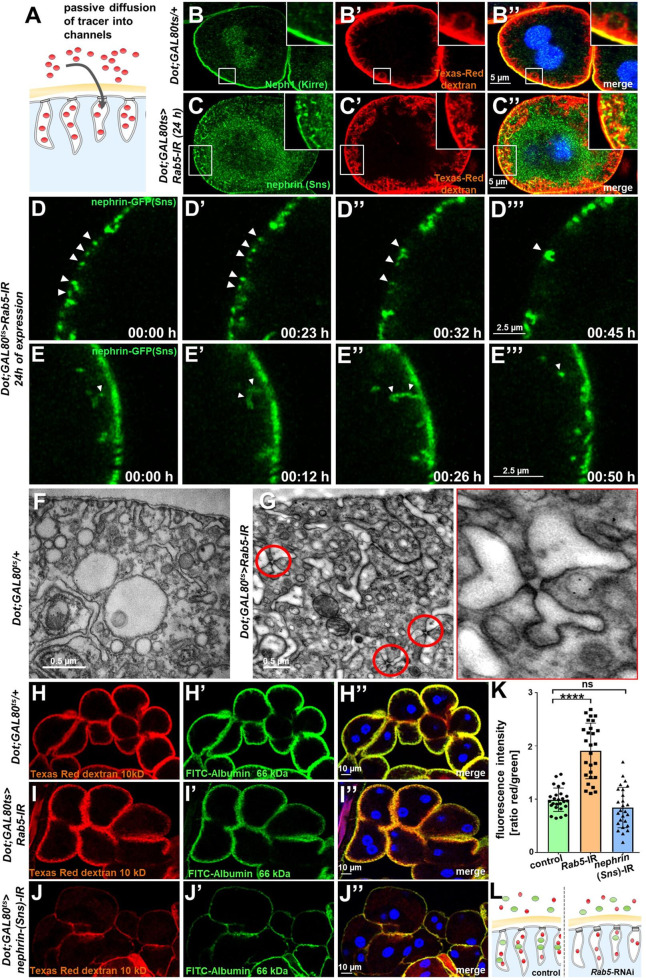
Figure 4. Endocytosis prevents lateral diffusion of nephrin and preserves filter permeability.
(A) Schematic illustrates the assay for visualization of labyrinthine channels. Nephrocytes are fixed briefly before exposure to Texas-Red-Dextran that enters the channels by passive diffusion. (B) Confocal microscopy image of a control nephrocyte is stained for Neph1 (green) together with labeling of the channels by Texas-Red-Dextran (10 kDa, red). Channels extend directly below the slit diaphragms. Nuclei are marked by Hoechst 33342 in blue here and throughout the figure. (C) Confocal images of nephrocytes with short-term silencing of Rab5 show mislocalized fly nephrin below the cell surface that colocalizes significantly with the labyrinthine channels visualized by Texas-Red-Dextran (10 kDa). (D–E’’’) Snapshots from movies obtained by live-cell imaging are shown. Nephrocytes express nephrin-GFP (heterozygously) concomitant with Rab5-RNAi for 24 hr. Fusion and cluster formation (white arrowheads in panels D) of fly nephrin precedes appearance of gaps (D–D’’’). Similarly, formation of protrusions of slit diaphragm proteins from the cell surface is followed by a formation of vesicles (E–E’’’, white arrowheads). (F) Electron microscopy (EM) image from a cross section through the surface of a control nephrocyte reveals regular slit diaphragms bridging the membrane invaginations called labyrinthine channels. (G) EM image from a section through the surface of a nephrocyte expressing Rab5-RNAi acutely for 24 hr demonstrates ectopic formation of slit diaphragms forming rosette-like structures within the labyrinthine channels (red circles, magnification on the right). (H–J’’) Confocal microscopy images of nephrocytes after simultaneous uptake of tracers FITC-albumin (66 kDa, green) and Texas-Red-Dextran (10 kDa) are shown. Control nephrocytes show robust uptake of both tracers (H–H’’). Silencing of Rab5 acutely for 24 hr shows a stronger decrease in the uptake of the larger tracer FITC-albumin compared to smaller Texas-Red-Dextran (I–I’’). Both tracers are equally reduced upon nephrin silencing (J–J’’). (K) Quantitation of fluorescence intensity expressed as a ratio of Texas-Red-Dextran/FITC-albumin (small/large tracer) confirms a disproportionate reduction for the larger tracer for Rab5-RNAi but not nephrin-RNAi (mean ± standard deviation, n=9 animals per genotype, p<0.0001 for Rab5-RNAi, p>0.05 for nephrin-RNAi). (L) Schematic illustrates how incipient filter clogging affects uptake of larger tracer disproportionately.


