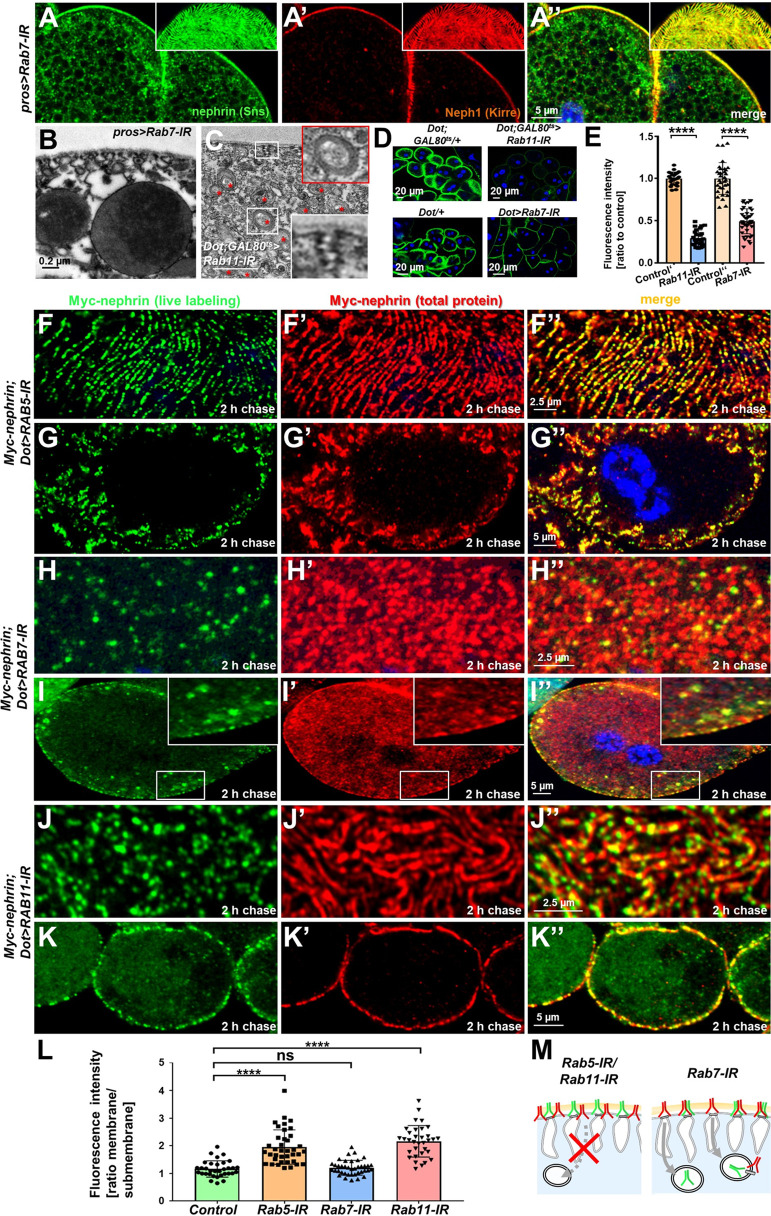
Figure 5. Endocytic uptake and Rab11-dependent recycling are required for slit diaphragm maintenance.
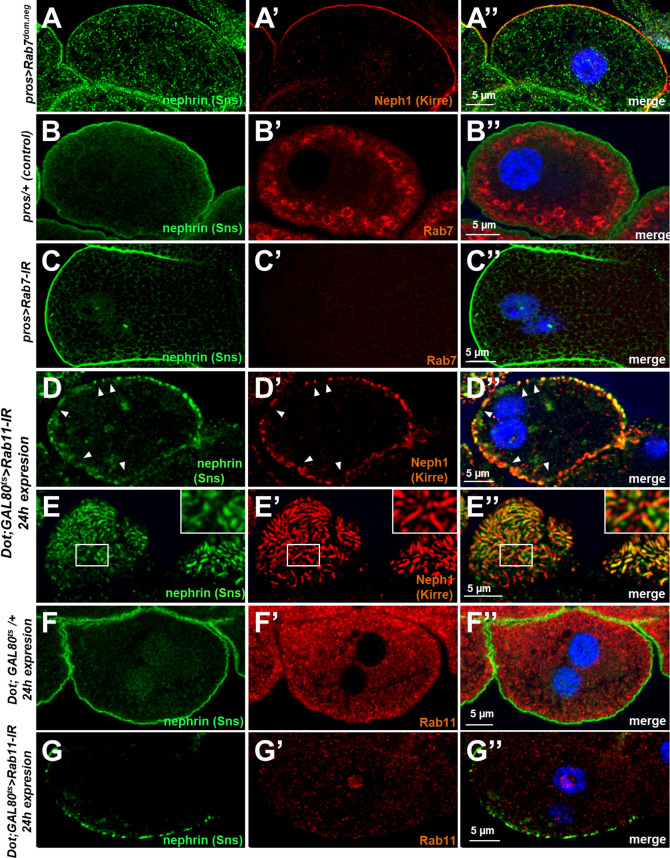
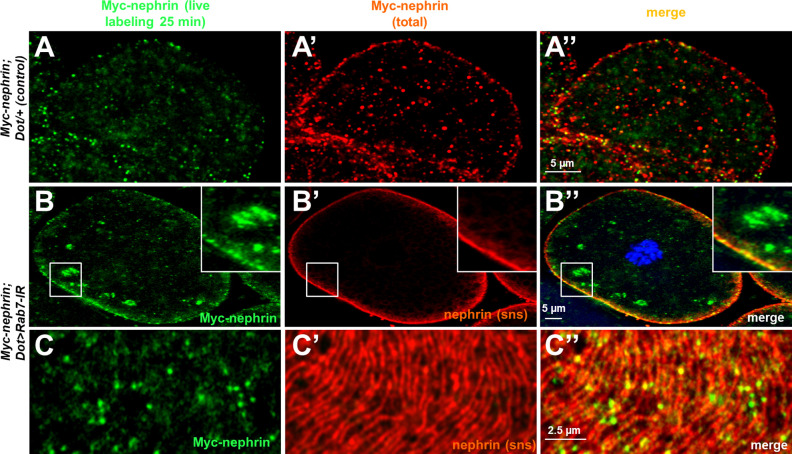
(A–A’’) Stainings of Rab7-RNAi nephrocytes reveal an additional faint signal for nephrin but not for Neph1 that likely reflects accumulation of nephrin upon defective degradation. Tangential sections (insets) show a regular fingerprint-like pattern, indicating undisturbed slit diaphragm formation. Nuclei are marked by Hoechst 33342 in blue here and throughout the figure. (B) Electron microscopy (EM) image of Rab7-RNAi nephrocyte shows normal slit diaphragms and large vesicles. (C) EM of nephrocyte expressing Rab11-RNAi reveals reduction of labyrinthine channels with multiple slits close to the cell surface (see inset) and expansion of lysosomes (red asterisks, see also magnified inset). Scale bar represents 0.2 µm. (D) FITC-albumin endocytosis as assay for nephrocyte function shows reduced uptake for Rab7-RNAi (lower panels) and Rab11-RNAi (upper panels) using Dorothy-GAL4 or prospero-GAL4 compared to the respective controls. (E) Quantitation of results from (D) in ratio to a control experiment performed in parallel (mean ± standard deviation, n=11–14 animals per genotype, p<0.0001 for Rab7-RNAi and n=9 animals per genotype p<0.0001 for Rab11-RNAi). Sidak post hoc analysis was used to correct for multiple comparisons. (F–K’’) Confocal microscopy images of tangential sections (F–F’’, H–H’’, J–J’’) and cross sections (G–G’’, I–I’’, K–K’’) of Myc-nephrin nephrocytes after live antibody labeling and 2 hr of chasing are shown for the indicated genotypes. Silencing of Rab5 at 18°C was obtained before flies were adapted to 25°C for 1 hr (F-G’’). Live labeling (green) and total stain (red) show near-complete colocalization for Rab5-RNAi (F–G’’), indicating disrupted nephrin turnover. Extensive amounts of subcortical nephrin are revealed in cross sections (G–G’’), compatible with lateral diffusion into the membrane invaginations. Cells expressing Rab7-RNAi after live antibody labeling show undisturbed nephrin turnover as the live labeled antibody is removed from the surface (H–H’’). Cross sections of Rab7-RNAi nephrocytes reveal numerous subcortical vesicles that partially show isolated signal for the live labeling, indicating the antibody disengaged from nephrin (I–I’’). Nephrocytes expressing Rab11-RNAi show strong retention of live labeled nephrin on the cell surface (J–J’’), suggesting impaired turnover. Cross sections show the antibody on the surface, but not in labyrinthine channels (K–K’’). (L) Quantitation of results from (F–K’’) expressed as ratio of the fluorescence intensity between surface and subcortical region for individual cells (mean ± standard deviation, n=11–13 animals per genotype, p<0.0001 for Rab5-RNAi, p>0.05 for Rab7-RNAi and p<0.0001 for Rab11-RNAi). (M) Schematic illustrates findings studying nephrin live labeling upon silencing of Rab5/Rab7/Rab11.


