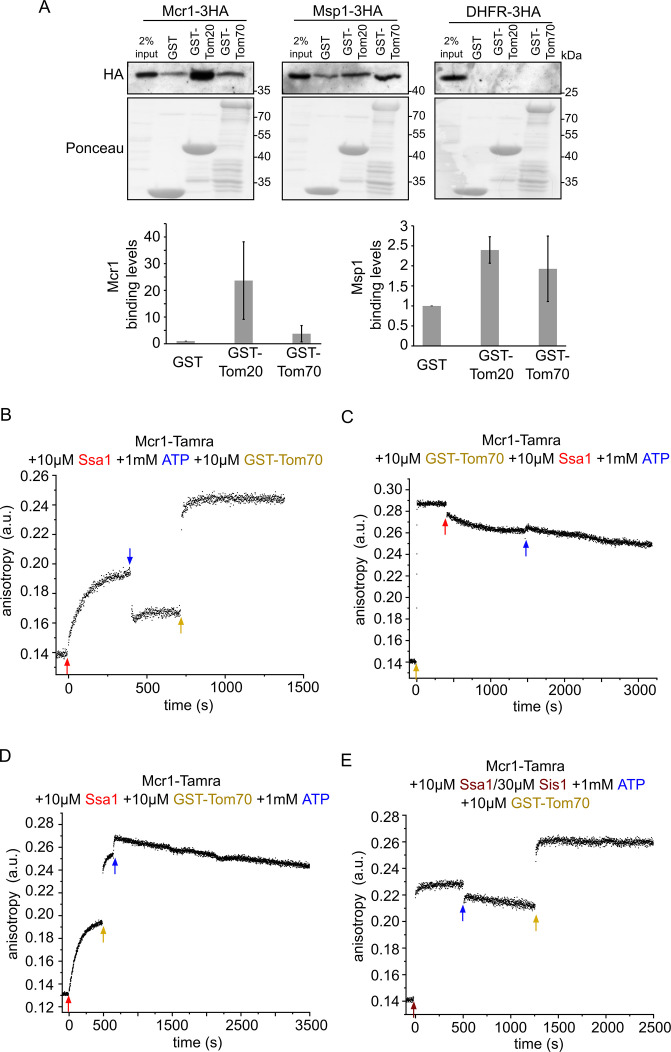
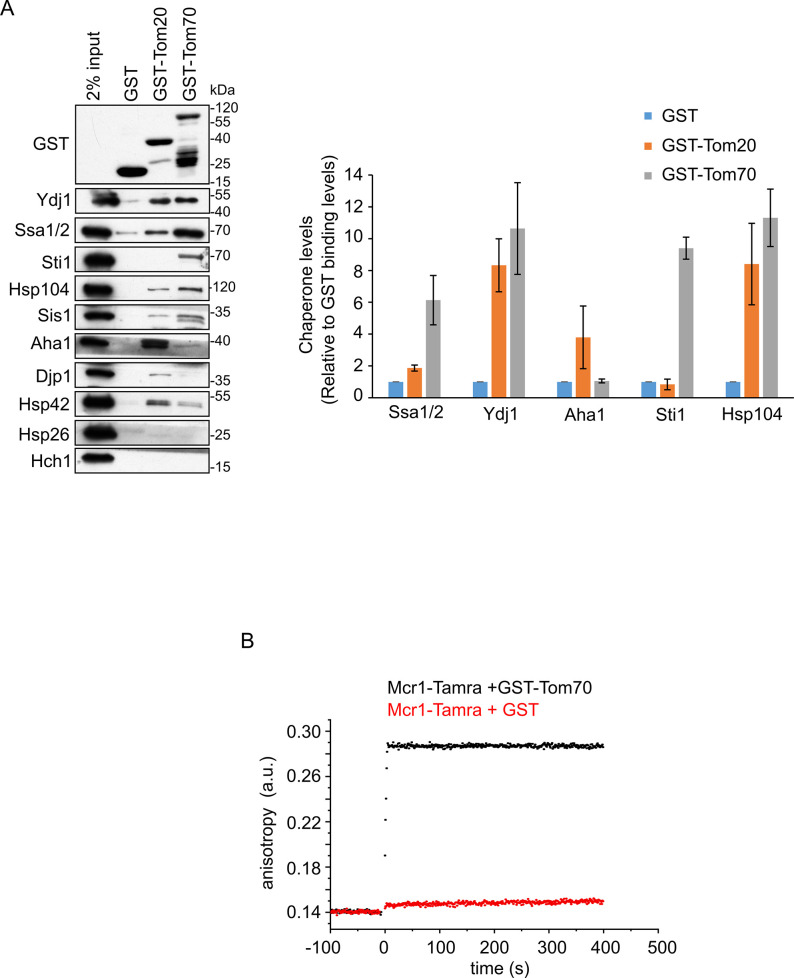
Figure 8. Newly synthesized signal-anchored proteins can be recognized by the cytosolic domains of the TOM receptors.
(A) HA-tagged versions of the signal-anchored proteins Mcr1 and Msp1 or of the control protein DHFR were freshly translated in yeast extract. Next, the newly translated proteins were mixed with GST alone or GST fused to the cytosolic domain of either Tom20 (GST-Tom20) or Tom70 (GST-Tom70) bound to glutathione beads. Input (2%) and eluate (100%) samples were subjected to SDS-PAGE. GST fusion proteins were detected by Ponceau staining whereas the HA-tagged proteins via immunodecoration against the HA-tag. Lower panels: Bands corresponding to Msp1-3HA and Mcr1-3HA from three independent experiments were quantified and the level of binding to GST alone was set as 1. Error bars represent ± SD. (B–D) Fluorescence anisotropy of TAMRA-labeled Mcr1 peptide was monitored after supplementing the reaction with 10 µM Ssa1, 1 mM ATP, or 10 µM GST-Tom70 in the indicated order. (E) As in panels B-D while the first addition was of 10 µM Ssa1 together with 30 µM Sis1, followed by addition of 1 mM ATP and then finally 10 µM GST-Tom70.


