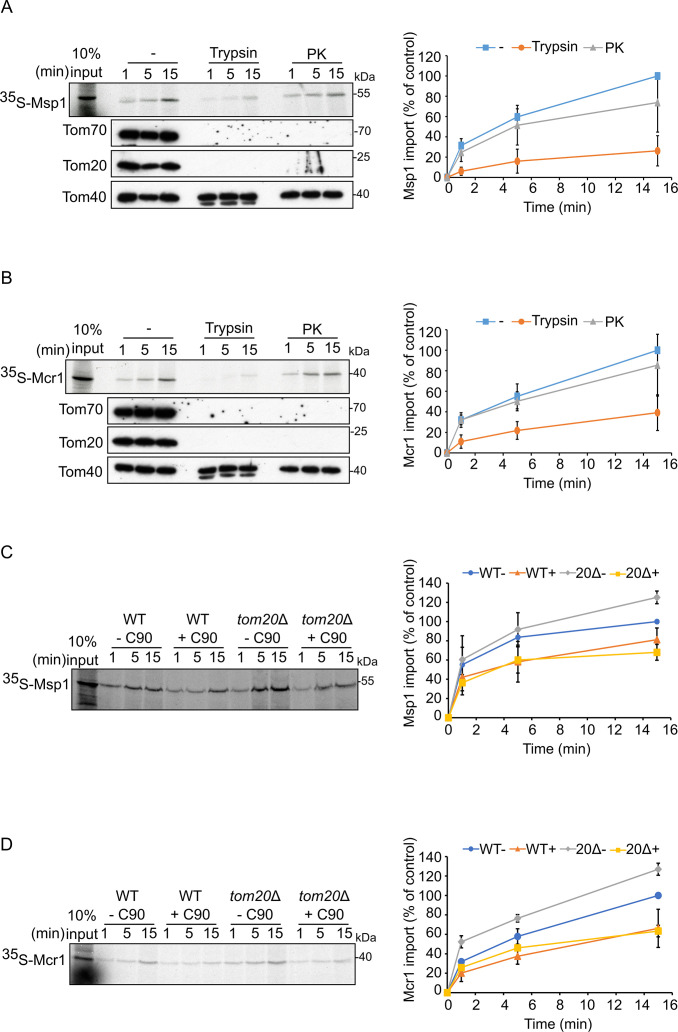
Figure 9. Tom70 and Tom20 may have offsetting function in mediating the biogenesis of Msp1 and Mcr1.
(A and B) Left panels: Radiolabeled Msp1 (A) and Mcr1 (B) were translated in yeast extract from WT cells and subjected to in vitro import assay using isolated mitochondria. Prior to the import reactions, isolated mitochondria were incubated for 30 min in the presence or absence of either trypsin or proteinase K (PK). After import for the indicated time periods, the samples were subjected to carbonate extraction and the pellet fractions were subjected to SDS-PAGE followed by autoradiography. To verify the activity of the proteases, the same membranes were immunodecorated with antibodies against the indicated proteins. Right panels: The bands corresponding to Msp1 or Mcr1 were quantified and the results of three independent experiments are presented as mean values ± SD. The intensities of the bands corresponding to import for 15 min in the absence of protease were set to 100%. (C and D) Left panels: Radiolabeled Msp1 (C) and Mcr1 (D) were translated in yeast extract from WT cells and subjected to in-vitro import assay using mitochondria isolated from either WT or tom20Δ cells. Prior to the import reactions, mitochondria were incubated in the presence or absence of 20 μM C90 (blocker of Tom70). After import for the indicated time points, the samples were subjected to carbonate extraction and the pellet fractions were analyzed by SDS-PAGE followed by autoradiography. Right panels: The bands corresponding to Msp1 or Mcr1 were quantified and the results of three independent experiments are presented as mean values ± SD. The intensities of the bands corresponding to import for 15 min in the absence of C90 were set to 100%.


