. 2022 Aug 5;11:e75863. doi: 10.7554/eLife.75863

Figure 3. Septin7 is critical for proper cellular development and myotube differentiation.

(A) Confocal images of Septin7 immunolabeling (green) and actin filaments (red) and their co-localization in control C2C12 cells. Calibration is 20 µm. Transmitted light images of control (B) and Septin7 knockout (KO; C) cells demonstrating that complete KO of Septin7 in C2C12 cells prevents appropriate cell proliferation. Scale bar is 50 µm for both the control and KO cells. (D) Partial knockdown (KD) of Septin7 expression at proliferation stage (nondifferentiated [ND]) and 5 days after differentiation induction (D5). 8 µg of protein samples from absolute control (Ctrl), scrambled transfected (Scr), and S7-KD cells in each case were loaded to SDS-PAGE gel, and following electrophoresis and blot transfer into nitrocellulose membrane, Septin7 (50 kDa) and α-actinin (110 kDa) were probed with the appropriate primary antibodies. Numbers 1, 2, and 3 at the bottom of the gels indicate Ctrl, Scr, and S7-KD samples, respectively. First and last lines in the ladders correspond to 35 and 250, and 70 and 250 kDa, for the upper and lower panels, respectively. Immunolabeling of Septin7 filaments in Scr (E) and S7-KD cells (F) demonstrating altered filament structure, cell size, and shape. Scale bar is 20 µm. Quantification of changes in cell morphology, area (G) and circularity (H) in S7-KD cultures. Green triangles represent Scr, while red squares represent S7-KD cells. The number of cells investigated was 96 in Scr and 121 in S7-KD cultures; *p<0.05, ***p<0.001 from t-test; experiment was repeated twice (N = 2). (I) Decreased proliferation 3 days after the plating assessed as CyQUANT fluorescence (n = 24; N = 3) and (J) suppressed differentiation of S7-KD cells determined by the calculation of fusion index during 6 days of investigation (n = 20; N = 2). Horizontal line in (J) shows where the difference between Scr and S7-KD cells was statistically significant (*p<0.05 from t-test). See also Figure 3—figure supplement 1 and Figure 3—figure supplement 2.

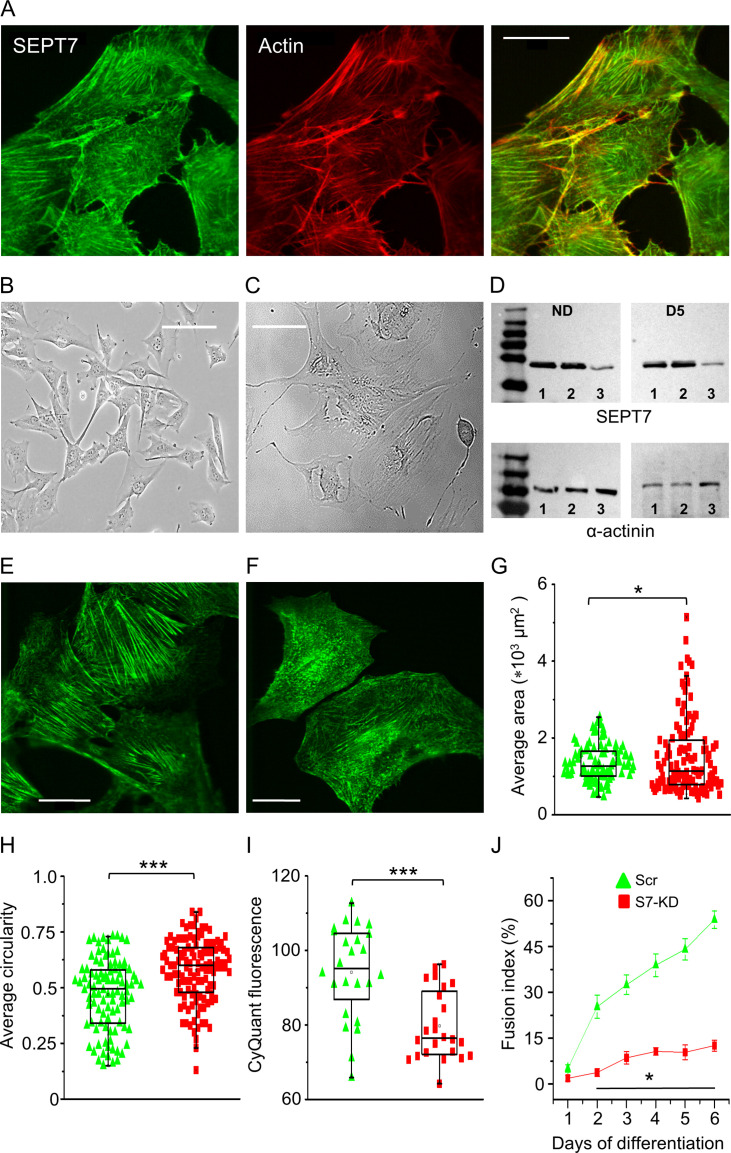
Figure 3—source data 1. Partial knockdown (KD) of Septin7 protein expression at proliferation stage (nondifferentiated [ND]) and following differentiation induction (D1–D2).
8 µg of protein samples from absolute control (Ctrl), scrambled transfected (Scr), and S7-KD cells in each case were loaded to SDS-PAGE gel, and following electrophoresis and blot transfer into nitrocellulose membrane, Septin7 (50 kDa) and α-actinin (110 kDa) were probed with the appropriate primary antibodies. Numbers 1, 2, and 3 at the bottom of the gels indicate Ctrl, Scr, and S7-KD samples, respectively. Relevant parts of the original gel images are presented in Figure 3D.
Figure 3—source data 2. Partial knockdown (KD) of Septin7 protein expression following differentiation induction (D3-D6).
Figure 3—source data 3. α-actinin protein expression at proliferation stage (ND) and following differentiation induction (D1-D2) in cultured C2C12 cells.
Figure 3—source data 4. α-actinin protein expression following differentiation induction (D3-D6) of cultured C2C12 cells.

Figure 3.

Figure 3—figure supplement 1. Septin7 filament structure and the effect of gene silencing on cellular parameters.

Figure 3—figure supplement 1.

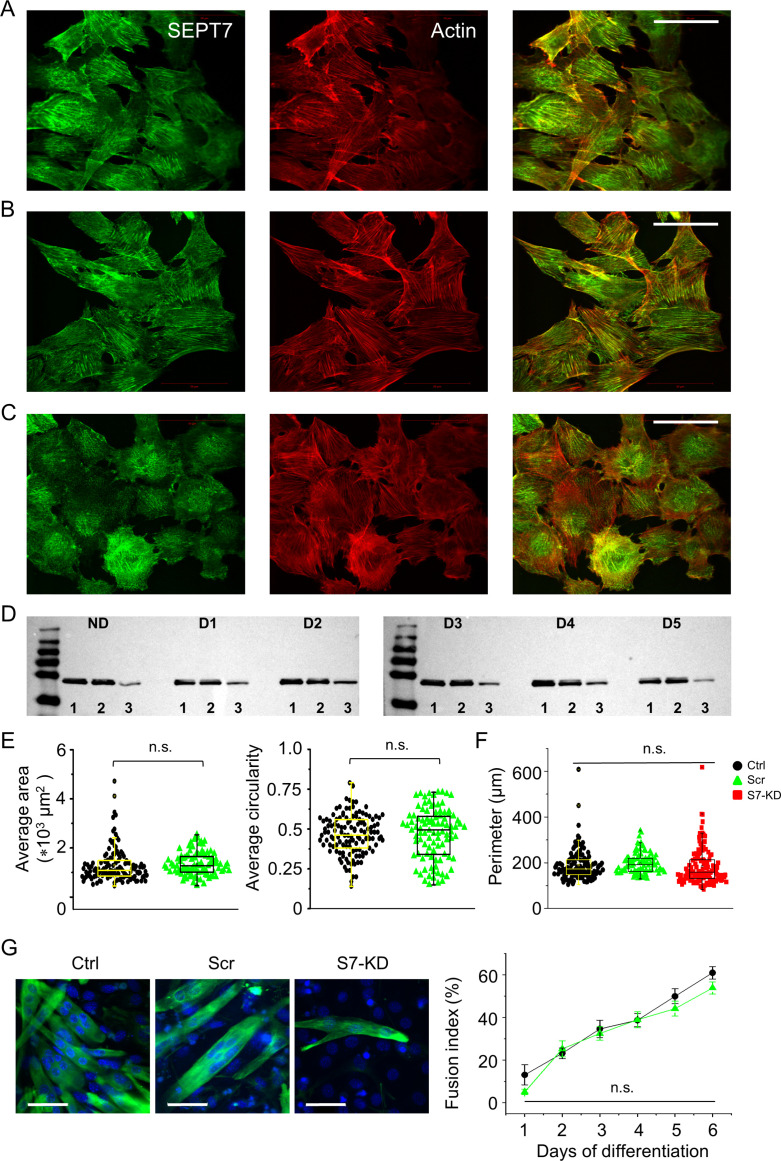
Intracellular localization of Septin7 (green) and actin (red) filaments individually and merged in control (Ctrl, A), scrambled (Scr, B), and S7-KD (C) C2C12 cells. Calibration is 50 µm. (D) Modified expression of Septin7 protein (50 kDa) was followed during the differentiation program of Ctrl, Scr, and S7-KD cells. ND refers to nondifferentiated, D1–D5 to appropriate days (1–5) following the induction of differentiation, while numbers 1, 2, and 3 at the bottom of the gels indicate Ctrl, Scr, and S7-KD samples, respectively. First and last lines in the ladders correspond to 35 and 250 kDa, respectively. (E) Quantitation of change in S7-KD cell morphology (area and circularity). Black circles represent data from control, while green triangles from scrambled cells. Individual data points (symbols) and average values (boxes with error bars) are shown for each group. The number of cells investigated was 127 in Ctrl, 96 in Scr, and 121 in S7-KD cultures; the experiment was repeated twice (N = 2). (F) Average perimeter was also calculated from different cells, and this data did not show significant difference between Ctrl (black), Scr (green), and S7-KD samples (red). (G) Representative confocal images from differentiated (D5) control, scrambled, and Septin7 KD cultures, where desmin (expressed only in myotubes) was fluorescently labeled using specific antibody (green), and nuclei were stained with DAPI (blue). Scale bars represent 50 µm. Differentiation during 6 days of culturing was assessed by calculating the fusion index in Ctrl (black) and Scr (green) cultures revealed to be not significantly different (n = 20; N = 2).
Figure 3—figure supplement 1—source data 1. Modified expression of Septin7 protein (50 kDa) in non-differentiated stage and 1-2 days following differentiation induction of Ctrl, Scr, and S7-KD cells.
ND refers to nondifferentiated, D1–D5 to appropriate days (1–5) following the induction of differentiation, while numbers 1, 2, and 3 at the bottom of the gels indicate Ctrl, Scr, and S7-KD samples, respectively. Relevant parts of the original gel images are presented in Figure 3—figure supplement 1D.
Figure 3—figure supplement 1—source data 2. Modified expression of Septin7 protein during the differentiation (D3-D6) program of Ctrl, Scr, and S7-KD cells.
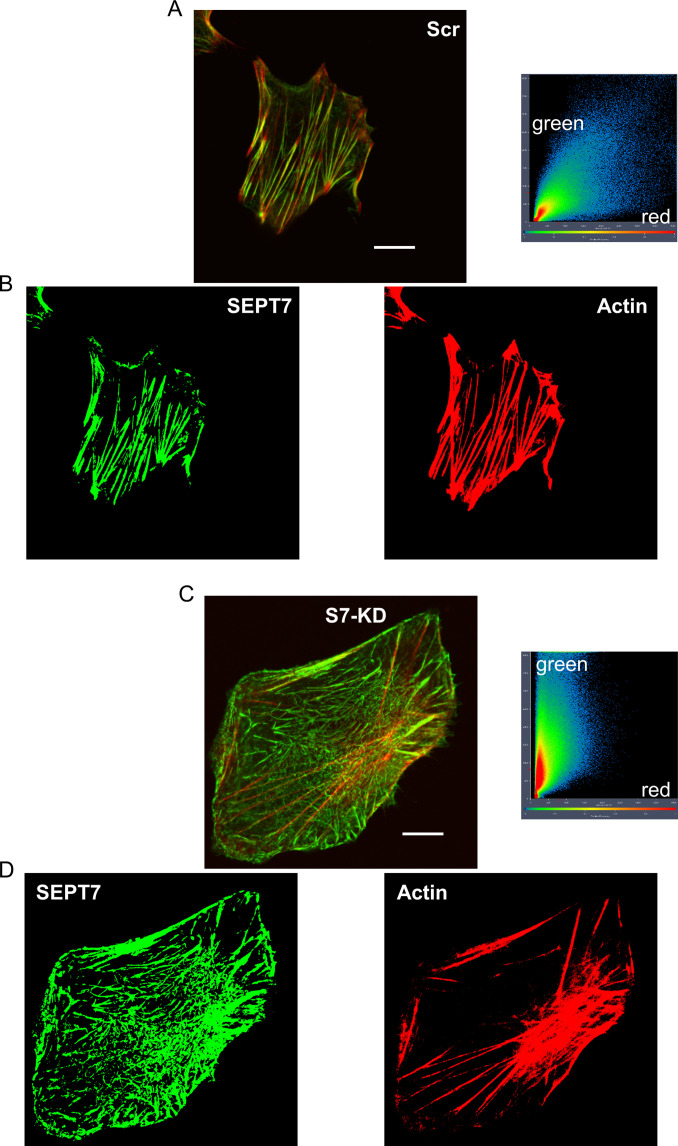
Figure 3—figure supplement 2. SEPT 7 downregulation modifies the intracellular architecture of C2C12 cells.

Figure 3—figure supplement 2.

Representative confocal images of Septin7 (green) and actin (red) filaments in Scr (A) and a S7-KD (B) C2C12 cell, where co-localization analysis was also performed. The Pearson’s coefficient was smaller for the S7-KD (B, 0.648) than for the Scr (A, 0.833) C2C12 cell. From the original merged images of scrambled (A) and S7-KD cells (B), Septin7 (in green) and actin filaments (in red) are separately presented for scrambled (C) and S7-KD (D) cells, respectively. Note the asymmetric distribution of intensities in case of S7-KD cells. Filamentous images (C, D) were created with thresholding of the separate channels. Scale bar in panels (A) and (B) corresponds to 10 μm.