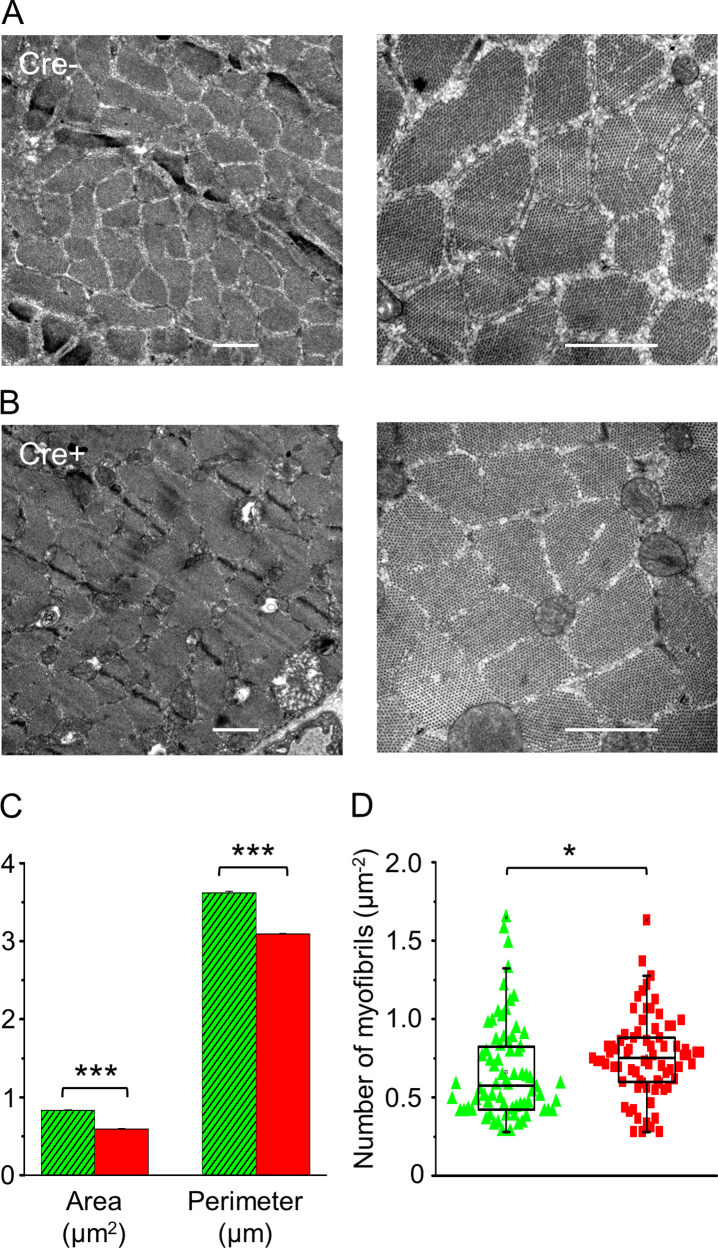
Figure 4. In vivo knockdown of Septin7 alters myofibrillar structure.
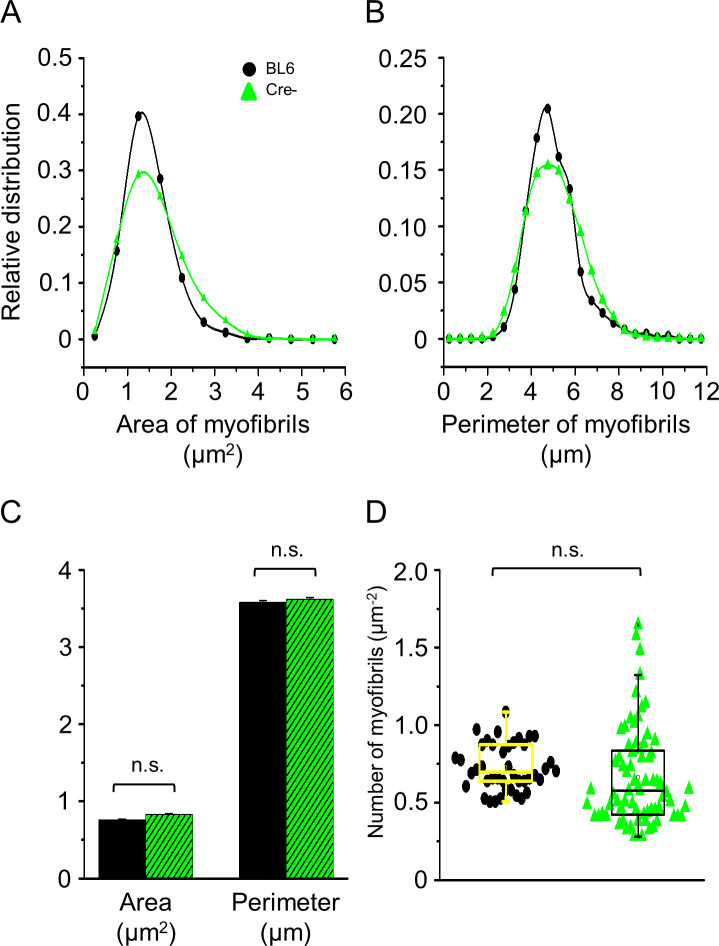
(A, B) Representative electron microscopy (EM) images of myofibrils from cross-sectional samples of m. tibialis anterior (TA) muscles from Cre- and Cre+ mice at smaller (left) and larger (right) magnification where scale bars represent 1 μm. (C, D) Area and perimeter of the individual myofibrils and the number of myofibrils within 1 µm2 of an appropriate visual field were determined from EM images. Here and in all subsequent figures, green columns represent data from Cre-, while red columns from Cre+ animals (average ± SEM). The total number of myofibrils counted for area and perimeter was 3012 and 3174 in Cre- and Cre+ mice, respectively, while the number of visual fields examined was 72 and 74, for calculating the number of myofibrils (*p<0.05; ***p<0.001 from t-test). See also Figure 4—figure supplement 1.


