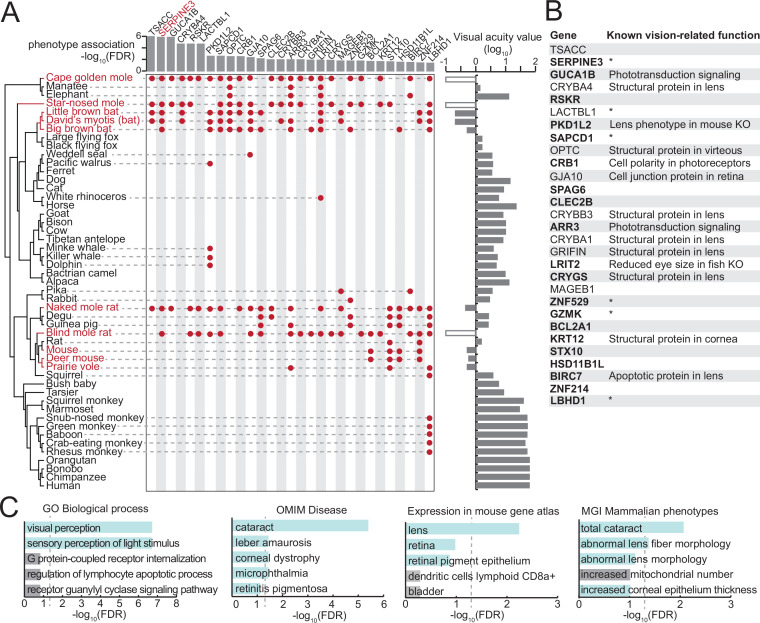
Figure 1. A comparative genomics screen uncovered known and novel vision-related genes.
(A) Phylogeny of the species included in our screen (left). Visual acuity values on a log10 scale are shown on the right as a bar chart; white boxes indicate the three subterranean mammals that lack acuity measurements but are functionally blind. Low-acuity species (red font) are defined here as species with visual acuity <1 (log10(va) <0). At a false discovery rate (FDR) threshold of 0.05, our screen retrieved 29 genes, which are preferentially lost in low-acuity species. Gene losses in individual species are denoted by red dots. The FDR value for the gene loss – phenotype association is shown at the top as a bar chart. (B) List of 29 genes, together with known vision-related functions. Asterisk marks genes that have no known vision-related function but were mentioned in large-scale gene expression data sets of ocular tissues. Genes in bold are expressed in human eyes according to the eyeIntegration database (Bryan et al., 2018) (see Methods). KO - knockout. (C) Functional enrichments of the 29 genes reveals vision-related functions (Gene Ontology, GO of biological processes), associations with human eye disorders (OMIM), expression in ocular tissues in the mouse gene atlas (Kuleshov et al., 2016) and eye phenotypes in mouse gene KOs (MGI Mammalian Phenotype level 4) among the top five most significant terms. Vision-related terms are shown as blue bars. The dashed line indicates statistical significance in a one-sided Fisher’s exact test after correcting for multiple testing using the Benjamini-Hochberg procedure (FDR 0.05).


