. 2022 Mar 9;3(3):181–193. doi: 10.1158/2643-3230.BCD-22-0013

Figure 1.

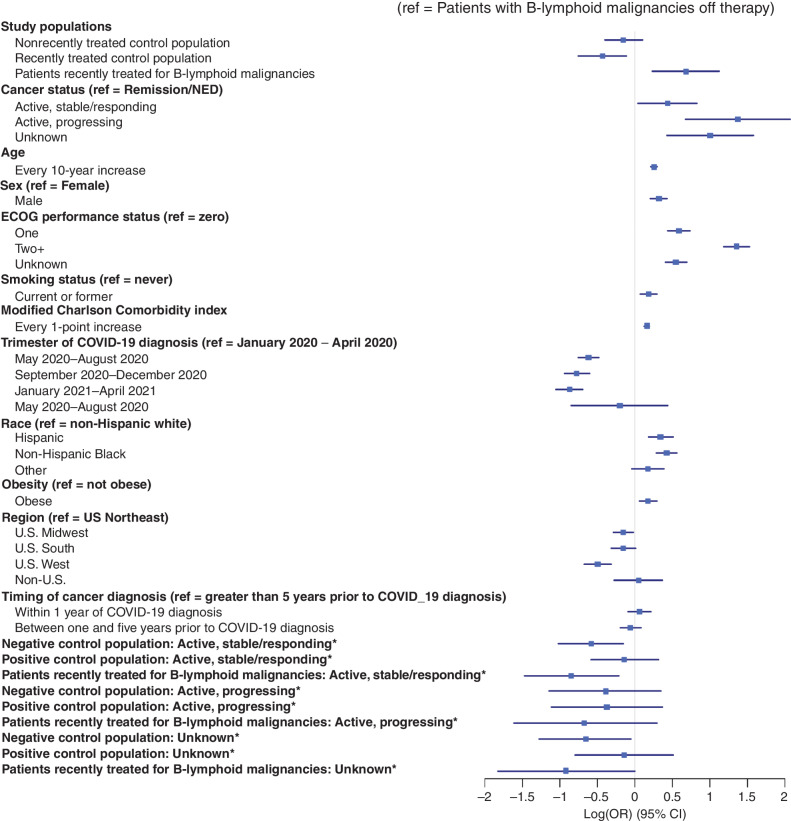
Figure 1. Factors associated with COVID-19 severity. Forest plot visualization of the independent association of the covariates in the primary analysis with COVID-19 severity. Associations are represented as the log of the odds ratio of COVID-19 severity. Interaction terms are indicated with an asterisk.

Factors associated with COVID-19 severity. Forest plot visualization of the independent association of the covariates in the primary analysis with COVID-19 severity. Associations are represented as the log of the odds ratio of COVID-19 severity. Interaction terms are indicated with an asterisk.