. 2022 Apr 12;21(6):871–878. doi: 10.1158/1535-7163.MCT-21-0950

Figure 1.

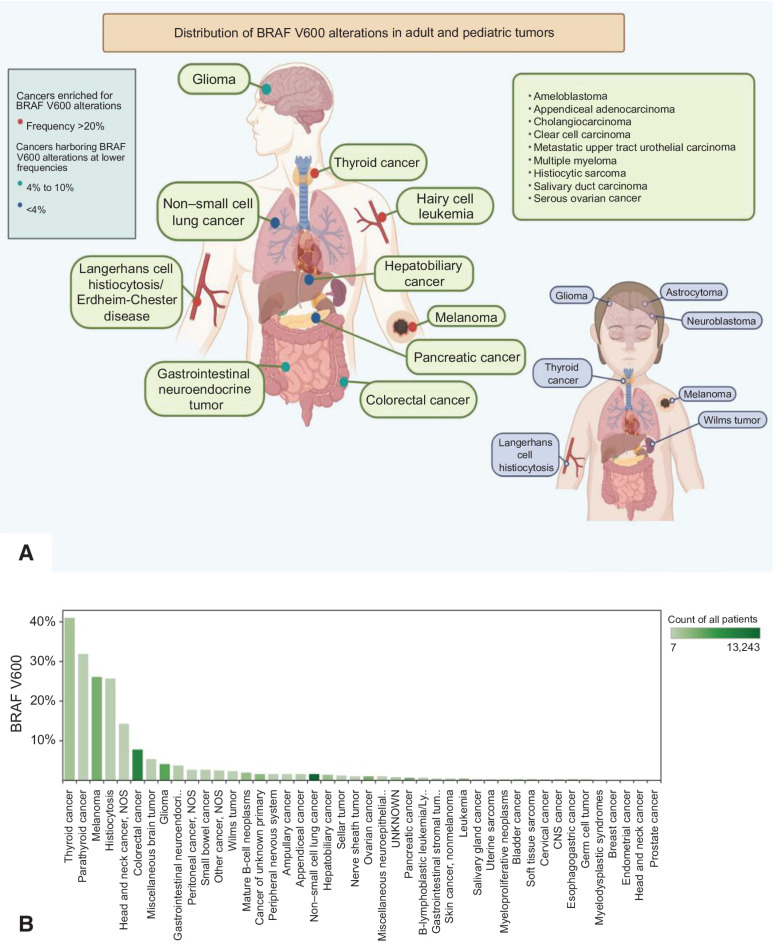
Figure 1. A, Distribution of BRAF V600 mutations in adult and pediatric tumors. B, Frequency of BRAF V600 mutations by tumor histology. Figure panel A is a cartoon schematic with examples of various BRAF-mutated nonmelanoma cancers and the distribution in adult and pediatric tumors. Figure panel B shows the frequency of BRAF V600 mutations in 43 different tumor types across 2,963 samples in the AACR GENIE database.

A, Distribution of BRAF V600 mutations in adult and pediatric tumors. B, Frequency of BRAF V600 mutations by tumor histology. Figure panel A is a cartoon schematic with examples of various BRAF-mutated nonmelanoma cancers and the distribution in adult and pediatric tumors. Figure panel B shows the frequency of BRAF V600 mutations in 43 different tumor types across 2,963 samples in the AACR GENIE database.