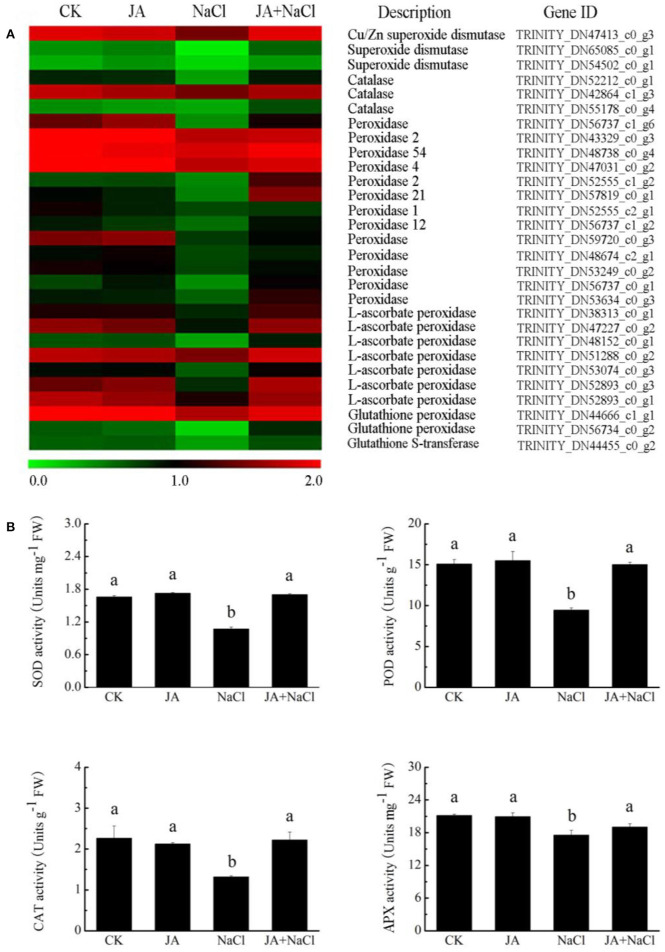
Figure 6.
Effects of exogenous jasmonic acid on redox-related gene expression and antioxidant enzyme activities in wheat seedlings under salt stress. (A) Heatmap of DEG expressions. The bar represents the scale of the expression level for each gene as indicated by green (low expression) and red rectangles (high expression). (B) Activities of SOD, POD, CAT and APX. CK, control group; NaCl, alone salt stress; JA, 100 μM JA alone; JA + NaCl, salt stress combined with 100 μM JA. The bars (means ± SD, n = 6) labeled with different letters indicate significant differences (p < 0.05) between treatments according to Duncan's multiple range test.

