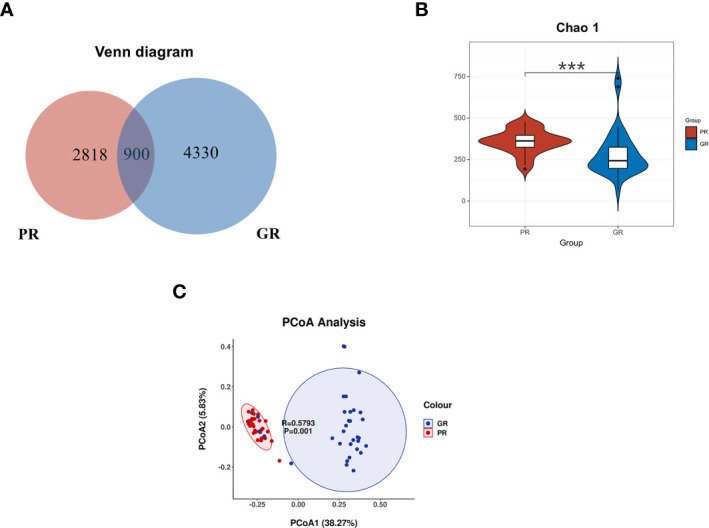
Figure 2.

Comparison of the bacterial structure between the PR and GR groups. (A) Venn diagram presents the ASV numbers. (B) α diversity analysis of GR and PR. Chao1 index (P = 0.00018) revealed the ASV count. (C) PcoA analysis indicated that the microbiome samples were clustered in two groups. *p < 0.05; **p < 0.01; ***p < 0.001; ****p < 0.0001. PR, poor response; GR, good response.
