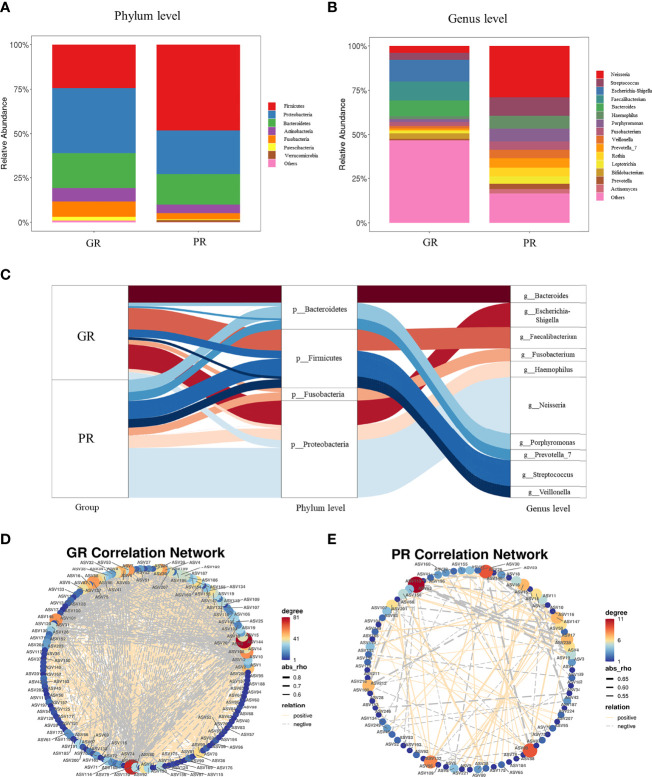
Figure 3.
Comparison of the relative abundances at the phylum and genus levels. (A, B) The composition of bacteria at the phylum level (A) and at the genus level (B). (C) Sankey plot visually showed the top relative abundance of bacteria at phylum and genus levels in both the GR and PR groups. (D, E) ASVs correlation network analysis. In total, SparCC correlation coefficients of |rho| >0.5 and P value <0.05 were used. The edge thickness indicates the strength of the correlation. The node size and color represent the number of other bacteria associated with the bacterium. PR, poor response; GR, good response.

