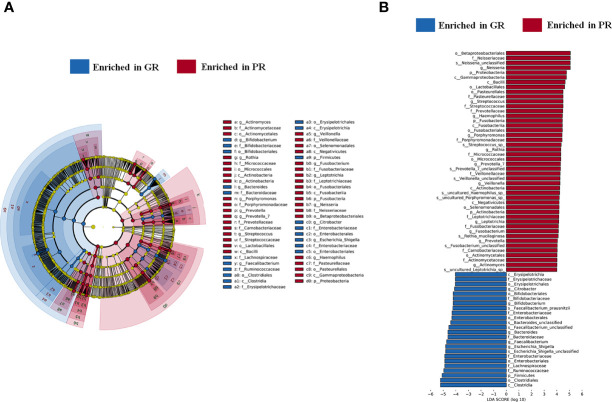
Figure 4.
Marked differences in the abundance of gut microbiome at all taxonomic levels between GR and PR groups obtained by using the linear discriminant analysis (LDA) effect size (LEfSe) method; (A) The enriched taxa in GR and PR gut microbiome represented in the cladogram. The central point represents the root of the tree (Bacteria), and each ring represents the next lower taxonomic level (phylum to genus: p, phylum; c, class; o, order; f, family; g, genus). The diameter of each circle represents the relative abundance of the taxon. (B) Histogram of the LDA scores computed for differentially abundant taxa between GR and PR. The LDA score indicates the effect size and ranking of each differentially abundant taxon. P < 0.01, LDA >4. PR, poor response; GR, good response.

