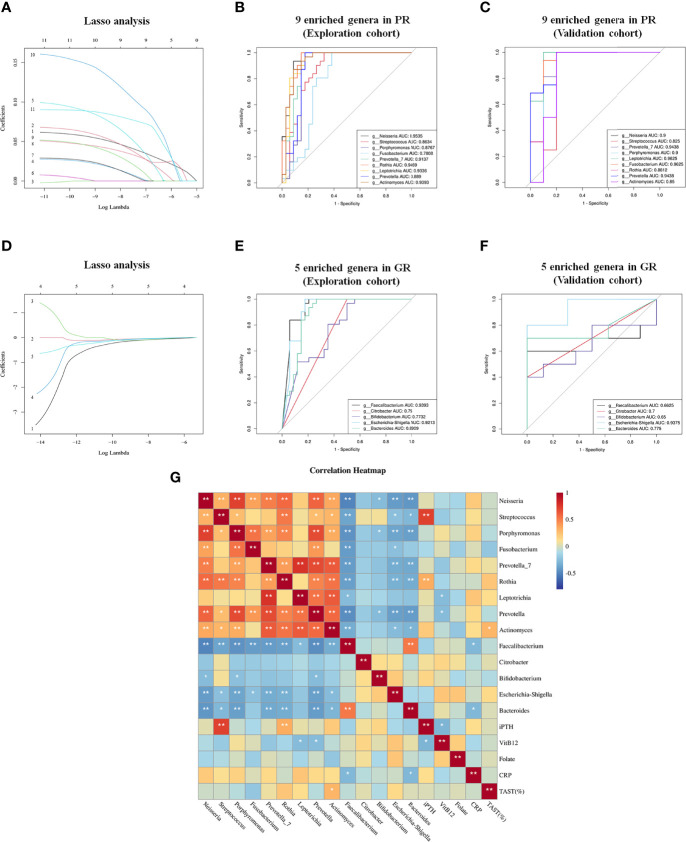
Figure 5.
Lasso regression model and ROC to further identify biomarkers to distinguish GR from PR. (A) Lasso regression model of 11 genera filtered from LEfSe analysis; 1, g:Neisseria 2, g: Streptococcus 3, g:Haemophilus 4, g:Porphyromonas 5, g:Fusobacterium 6, g:Veillonella 7, g:Prevotella_7 8, g:Rothia 9, g:Leptotrichia 10, g:Prevotella 11, g:Actinomyces. (B, C) ROC curves of nine Lasso-selected genera in the exploration and validation cohorts with P < 0.05. (D) Lasso regression model of five genera enriched in GR filtered from LEfSe analysis. 1, g:Faecalibacterium 2, g:Citrobacter 3, g:Bifidobacterium 4, g:Escherichia-Shigella 5, g:Bacteroides. (E, F) ROC curve of five Lasso-selected genera in exploration and validation cohort with P < 0.05. PR, poor response; GR, good response. (G) Correlation analysis between biomarkers and potential indicators associated with EH. *p < 0.05; **p < 0.01.

