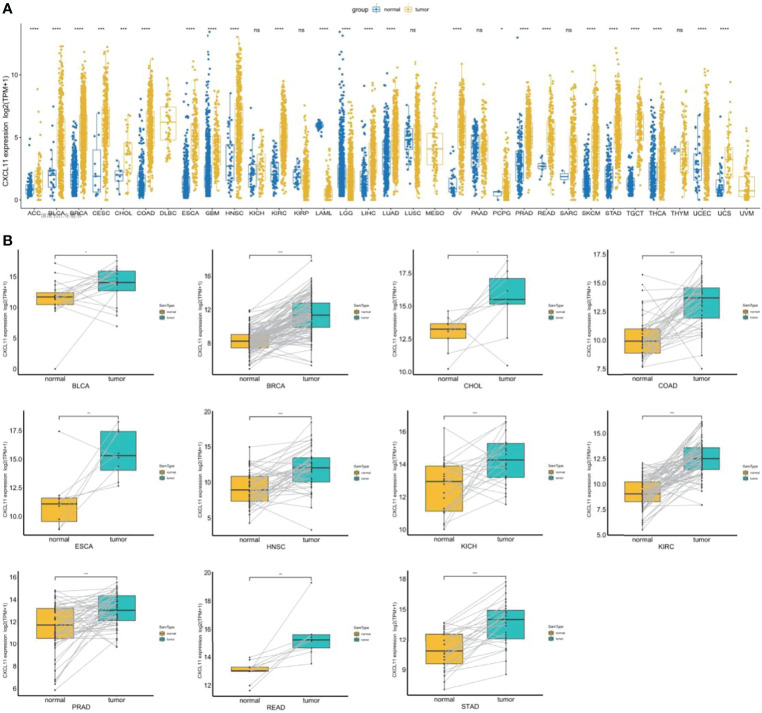
Figure 1.
CXCL11 profile across cancers. (A) The expression of CXCL11 across normal and tumor tissues in the integrated GTEx database and TCGA database. (B) According to TCGA data, the levels of CXCL11 in corresponding tumors and normal tissues in BLCA, BRCA, CHOL, COAD, ESCA, HNSC, KICH, KIRC, PRAD, READ, and STAD. ns denotes not statistically significant, *p < 0.05, **p < 0.01, ***p <0.001, ****p < 0.0001.

