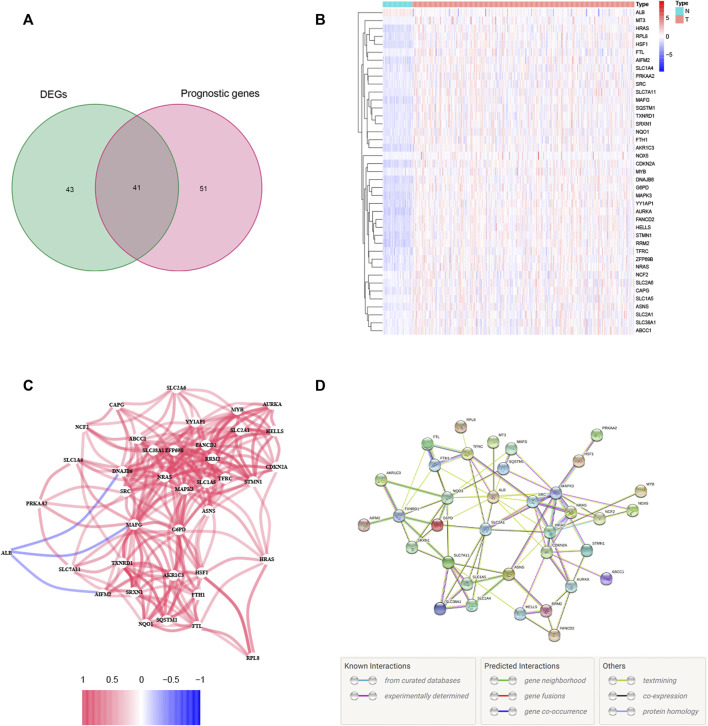
FIGURE 1.
Identification of the candidate ferroptosis-related genes (FRGs) with differential expression and prognostic value in the TCGA cohort. (A) Venn diagram showing identified ferroptosis-related DEGs with prognostic value. (B) Heatmap showing the expression of the 41 overlapping genes between tumor and adjacent tissues. (C) The correlation network of candidate genes. The red line represents the positive correlation, while the blue line represents the negative correlation. (D) The PPI network indicated the interactions among the candidate genes.

